Descriptive Analytics:Pasta
Contents
Descriptive Analytics:Pasta#
Imports#
import pandas as pd
import matplotlib.pyplot as plt
import numpy as np
import scipy as sp
import seaborn as sns
import plotnine
sns.set()
Read Data#
df = pd.read_csv("W101_PASTAPURCHASE_EDITED.csv"); df.head()
| HHID | TIME | PASTA | EXPOS | AGE | INCOME | AREA | |
|---|---|---|---|---|---|---|---|
| 0 | 1 | 1 | 0.939444 | 1 | 61.710758 | 25186.798772 | 3 |
| 1 | 1 | 2 | 2.560969 | 2 | 61.710758 | 25186.798772 | 3 |
| 2 | 1 | 3 | 0.901123 | 0 | 61.710758 | 25186.798772 | 3 |
| 3 | 1 | 4 | 1.916530 | 1 | 61.710758 | 25186.798772 | 3 |
| 4 | 1 | 5 | 1.548751 | 0 | 61.710758 | 25186.798772 | 3 |
df.info()
<class 'pandas.core.frame.DataFrame'>
RangeIndex: 40000 entries, 0 to 39999
Data columns (total 7 columns):
 #   Column  Non-Null Count  Dtype
---  ------  --------------  -----
 0   HHID    40000 non-null  int64
 1   TIME    40000 non-null  int64
 2   PASTA   40000 non-null  float64
 3   EXPOS   40000 non-null  int64
 4   AGE     40000 non-null  float64
 5   INCOME  40000 non-null  float64
 6   AREA    40000 non-null  int64
dtypes: float64(3), int64(4)
memory usage: 2.1 MB
df.describe()
| HHID | TIME | PASTA | EXPOS | AGE | INCOME | AREA | |
|---|---|---|---|---|---|---|---|
| count | 40000.000000 | 40000.000000 | 40000.000000 | 40000.000000 | 40000.000000 | 40000.000000 | 40000.000000 |
| mean | 1000.500000 | 10.500000 | 1.841545 | 0.499100 | 42.251409 | 27096.126112 | 2.996000 |
| std | 577.357414 | 5.766353 | 1.025911 | 0.702041 | 13.766646 | 15928.188291 | 1.409622 |
| min | 1.000000 | 1.000000 | 0.000000 | 0.000000 | 18.007529 | 609.107170 | 1.000000 |
| 25% | 500.750000 | 5.750000 | 1.108936 | 0.000000 | 30.505706 | 15379.591862 | 2.000000 |
| 50% | 1000.500000 | 10.500000 | 1.811417 | 0.000000 | 42.436092 | 24487.068020 | 3.000000 |
| 75% | 1500.250000 | 15.250000 | 2.534365 | 1.000000 | 54.362395 | 35272.533787 | 4.000000 |
| max | 2000.000000 | 20.000000 | 6.592769 | 5.000000 | 64.984126 | 141066.966883 | 5.000000 |
df_agg = df.groupby("AREA")['INCOME'].agg(['min', 'max', 'mean'])
df_agg.sort_values(by='mean')
| min | max | mean | |
|---|---|---|---|
| AREA | |||
| 3 | 2353.176959 | 111295.840727 | 25879.485698 |
| 5 | 1331.260222 | 141066.966883 | 26030.910606 |
| 2 | 609.107170 | 106319.106367 | 26218.857948 |
| 1 | 2740.776521 | 85241.329860 | 28076.599968 |
| 4 | 1241.960729 | 112983.969631 | 29260.133137 |
df.groupby('HHID')['PASTA'].agg(['sum']).sort_values(by='sum', ascending=False)
| sum | |
|---|---|
| HHID | |
| 1493 | 55.361931 |
| 1511 | 51.030304 |
| 151 | 50.816654 |
| 647 | 50.771865 |
| 916 | 50.502666 |
| ... | ... |
| 92 | 23.926629 |
| 267 | 23.380097 |
| 572 | 23.225390 |
| 1921 | 21.738494 |
| 1917 | 19.256710 |
2000 rows × 1 columns
df[(df['AREA']==2) & (df['INCOME']> 20000)].groupby('HHID').agg('sum').query("PASTA>30").count()
TIME      218
PASTA     218
EXPOS     218
AGE       218
INCOME    218
AREA      218
dtype: int64
df[['PASTA', 'EXPOS']].corr()
| PASTA | EXPOS | |
|---|---|---|
| PASTA | 1.000000 | 0.326617 |
| EXPOS | 0.326617 | 1.000000 |
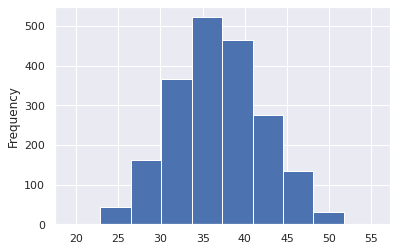
df.groupby('HHID')['PASTA'].sum().plot(kind='hist')
<AxesSubplot:ylabel='Frequency'>

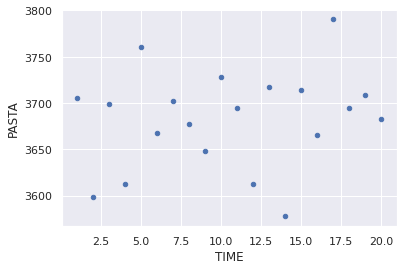
df.groupby('TIME')['PASTA'].sum().reset_index().plot.scatter(y='PASTA',x='TIME')
*c* argument looks like a single numeric RGB or RGBA sequence, which should be avoided as value-mapping will have precedence in case its length matches with *x* & *y*. Please use the *color* keyword-argument or provide a 2D array with a single row if you intend to specify the same RGB or RGBA value for all points.
<AxesSubplot:xlabel='TIME', ylabel='PASTA'>


