Statistical Segmentation
Contents
Statistical Segmentation#
Topics Covered
SQL
RFM Transformation
Sampling
Hierarichal Clustering and Dendogram
Imports#
import pandas as pd
import numpy as np
import scipy as sp
import matplotlib.pyplot as plt
import seaborn as sns
import datetime as dt
from sklearn.cluster import AgglomerativeClustering
from scipy.cluster.hierarchy import dendrogram, linkage
from sklearn.pipeline import Pipeline, make_pipeline
from sklearn.preprocessing import StandardScaler, RobustScaler, FunctionTransformer
sns.set()
Read Dataset#
df = pd.read_csv("W106_purchases.txt", sep='\t',
                 names=['consumer_id', 'purchase_amount', 'date_of_purchase'],
                 parse_dates=['date_of_purchase']); df.head()
| consumer_id | purchase_amount | date_of_purchase | |
|---|---|---|---|
| 0 | 760 | 25.0 | 2009-11-06 |
| 1 | 860 | 50.0 | 2012-09-28 |
| 2 | 1200 | 100.0 | 2005-10-25 |
| 3 | 1420 | 50.0 | 2009-07-09 |
| 4 | 1940 | 70.0 | 2013-01-25 |
df['year_of_purchase'] = df['date_of_purchase'].dt.year
df.describe(include='all')
/tmp/ipykernel_22169/2884002236.py:1: FutureWarning: Treating datetime data as categorical rather than numeric in `.describe` is deprecated and will be removed in a future version of pandas. Specify `datetime_is_numeric=True` to silence this warning and adopt the future behavior now.
  df.describe(include='all')
| consumer_id | purchase_amount | date_of_purchase | year_of_purchase | |
|---|---|---|---|---|
| count | 51243.000000 | 51243.000000 | 51243 | 51243.000000 |
| unique | NaN | NaN | 1879 | NaN |
| top | NaN | NaN | 2013-12-31 00:00:00 | NaN |
| freq | NaN | NaN | 864 | NaN |
| first | NaN | NaN | 2005-01-02 00:00:00 | NaN |
| last | NaN | NaN | 2015-12-31 00:00:00 | NaN |
| mean | 108934.547938 | 62.337195 | NaN | 2010.869699 |
| std | 67650.610139 | 156.606801 | NaN | 2.883072 |
| min | 10.000000 | 5.000000 | NaN | 2005.000000 |
| 25% | 57720.000000 | 25.000000 | NaN | 2009.000000 |
| 50% | 102440.000000 | 30.000000 | NaN | 2011.000000 |
| 75% | 160525.000000 | 60.000000 | NaN | 2013.000000 |
| max | 264200.000000 | 4500.000000 | NaN | 2015.000000 |
max_date=df['date_of_purchase'].max()+dt.timedelta(days=1)
df['days_since_purchase']=(max_date - df['date_of_purchase']).dt.days
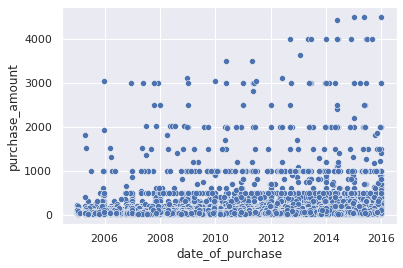
sns.scatterplot(data=df, x='date_of_purchase', y='purchase_amount')
<AxesSubplot:xlabel='date_of_purchase', ylabel='purchase_amount'>
df.groupby('days_since_purchase')['purchase_amount'].sum().plot.line(figsize=(24,6)).invert_xaxis()

consumer_df = df.groupby('consumer_id').agg({'purchase_amount':'mean', 'year_of_purchase':'last', 'days_since_purchase':'last', 'date_of_purchase':'count'})\
.rename(columns={'purchase_amount':'monetary',
                 'year_of_purchase':'last_purchase_year',
                 'days_since_purchase':'recency',
                 'date_of_purchase': 'frequency'})
consumer_df.head()
| monetary | last_purchase_year | recency | frequency | |
|---|---|---|---|---|
| consumer_id | ||||
| 10 | 30.000000 | 2005 | 3829 | 1 |
| 80 | 71.428571 | 2009 | 2457 | 7 |
| 90 | 115.800000 | 2012 | 1096 | 10 |
| 120 | 20.000000 | 2012 | 1401 | 1 |
| 130 | 50.000000 | 2005 | 3710 | 2 |
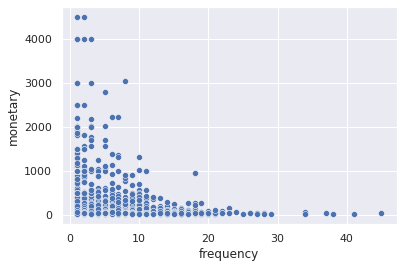
sns.scatterplot(data=consumer_df,y='monetary', x='frequency')
<AxesSubplot:xlabel='frequency', ylabel='monetary'>
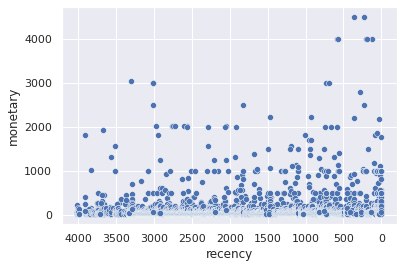
sns.scatterplot(data=consumer_df,y='monetary', x='recency').invert_xaxis()
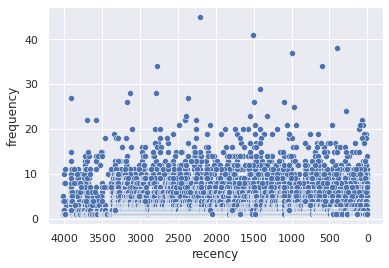
sns.scatterplot(data=consumer_df,y='frequency', x='recency').invert_xaxis()
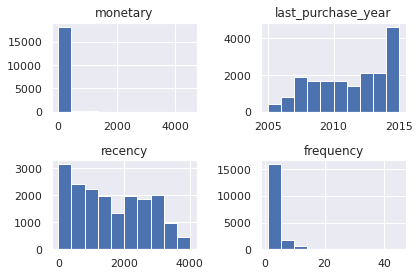
consumer_df.hist()
plt.tight_layout()
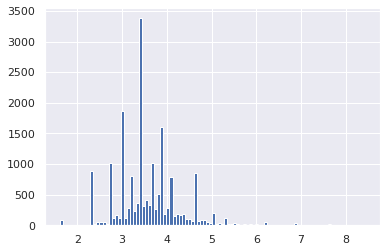
np.log(consumer_df['monetary']).hist(bins=100)
<AxesSubplot:>
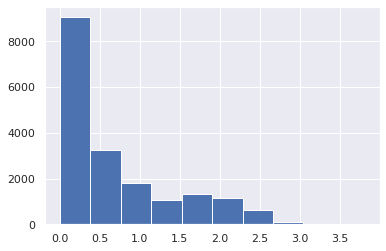
np.log(consumer_df['frequency']).hist()
<AxesSubplot:>
# np.log(consumer_df['recency']).hist()
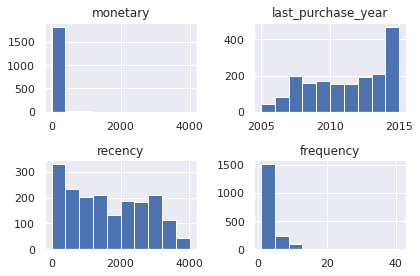
consumer_df.sample(frac=0.1).hist()
plt.tight_layout()
sample = consumer_df.sample(frac=0.1)
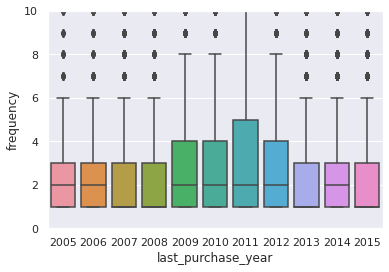
sns.boxplot(data=consumer_df, x='last_purchase_year', y='frequency').set(ylim=(0,10))
[(0.0, 10.0)]
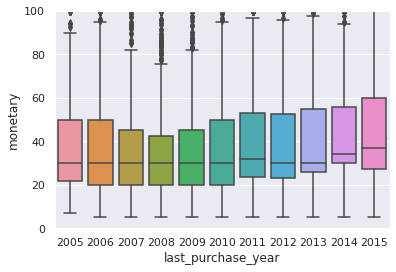
sns.boxplot(data=consumer_df, x='last_purchase_year', y='monetary').set(ylim=(0,100))
[(0.0, 100.0)]
Segmentation with Hierarchal Clustering#
def process_df(df):
    df_cp = df.copy()
    df_cp['frequency'] = np.log1p(df_cp['frequency'])
    df_cp['monetary'] = np.log1p(df_cp['monetary'])
    return df_cp
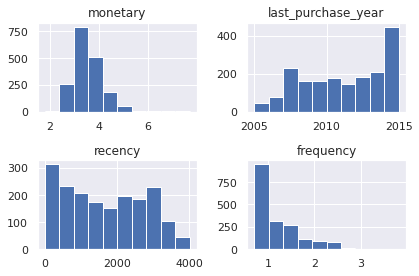
process_df(sample).hist()
plt.tight_layout()
def plot_dendrogram(model, **kwargs):
    # Create linkage matrix and then plot the dendrogram

    # create the counts of samples under each node
    counts = np.zeros(model.children_.shape[0])
    n_samples = len(model.labels_)
    for i, merge in enumerate(model.children_):
        current_count = 0
        for child_idx in merge:
            if child_idx < n_samples:
                current_count += 1  # leaf node
            else:
                current_count += counts[child_idx - n_samples]
        counts[i] = current_count

    linkage_matrix = np.column_stack(
        [model.children_, model.distances_, counts]
    ).astype(float)

    # Plot the corresponding dendrogram
    dendrogram(linkage_matrix, **kwargs)
pipeline = make_pipeline(FunctionTransformer(process_df), StandardScaler(),  AgglomerativeClustering(distance_threshold=0, n_clusters=None))
pipeline
Pipeline(steps=[('functiontransformer',
                 FunctionTransformer(func=<function process_df at 0x116c37259e50>)),
                ('standardscaler', StandardScaler()),
                ('agglomerativeclustering',
                 AgglomerativeClustering(distance_threshold=0,
                                         n_clusters=None))])
pipeline.fit(sample[['recency', 'frequency', 'monetary']])
model = pipeline['agglomerativeclustering']
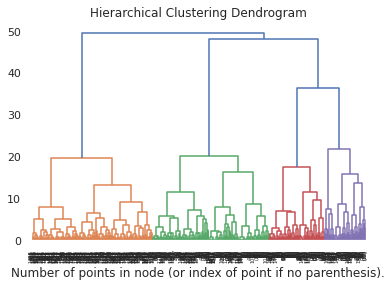
plt.title("Hierarchical Clustering Dendrogram")
# plot the top three levels of the dendrogram
plot_dendrogram(model, truncate_mode="level", p=9)
plt.xlabel("Number of points in node (or index of point if no parenthesis).")
plt.show()
pipeline2 = make_pipeline(FunctionTransformer(process_df), StandardScaler(),  AgglomerativeClustering(n_clusters=5))
pipeline2.fit(sample[['recency', 'frequency', 'monetary']])
pipeline2
Pipeline(steps=[('functiontransformer',
                 FunctionTransformer(func=<function process_df at 0x116c37259e50>)),
                ('standardscaler', StandardScaler()),
                ('agglomerativeclustering',
                 AgglomerativeClustering(n_clusters=5))])
sample['cluster'] = pipeline2.fit_predict(sample[['recency', 'frequency', 'monetary']])+1
sample
| monetary | last_purchase_year | recency | frequency | cluster | |
|---|---|---|---|---|---|
| consumer_id | |||||
| 134880 | 10.0 | 2009 | 2192 | 1 | 1 |
| 214990 | 30.0 | 2013 | 731 | 1 | 4 |
| 77150 | 30.0 | 2007 | 3102 | 1 | 1 |
| 88000 | 40.0 | 2007 | 2961 | 1 | 1 |
| 163970 | 29.0 | 2014 | 437 | 5 | 4 |
| ... | ... | ... | ... | ... | ... |
| 181050 | 10.0 | 2012 | 1188 | 1 | 4 |
| 144260 | 20.0 | 2010 | 1990 | 1 | 1 |
| 155540 | 20.0 | 2011 | 1688 | 1 | 4 |
| 61350 | 103.0 | 2011 | 1476 | 10 | 2 |
| 191070 | 12.5 | 2012 | 1097 | 2 | 4 |
1842 rows × 5 columns
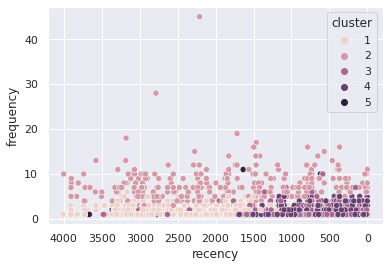
sns.scatterplot(data=sample,y='frequency', x='recency', hue='cluster').invert_xaxis()
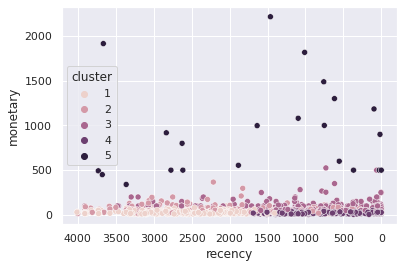
sns.scatterplot(data=sample,y='monetary', x='recency', hue='cluster').invert_xaxis()
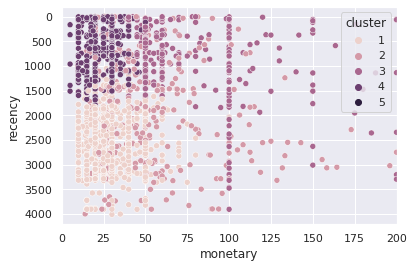
ax = sns.scatterplot(data=sample,x='monetary', y='recency', hue='cluster')
ax.set_xlim(0,200)
ax.invert_yaxis()
ax = sns.scatterplot(data=sample,x='monetary', y='frequency', hue='cluster')
ax.set_xlim(0,200)
# ax.invert_yaxis()
(0.0, 200.0)
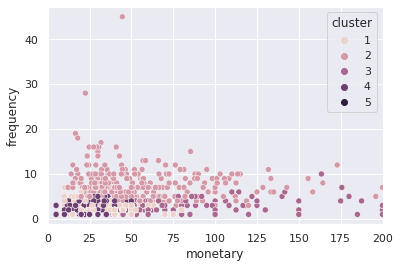
sample.reset_index().groupby('cluster').agg({'consumer_id':'count',
                                             'last_purchase_year':'max',
                                             'recency':['min','mean', 'max'],
                                             'frequency':['min','mean', 'max'],
                                             'monetary':['mean','sum']})
| consumer_id | last_purchase_year | recency | frequency | monetary | ||||||
|---|---|---|---|---|---|---|---|---|---|---|
| count | max | min | mean | max | min | mean | max | mean | sum | |
| cluster | ||||||||||
| 1 | 722 | 2013 | 1055 | 2593.411357 | 4012 | 1 | 1.674515 | 7 | 29.465882 | 21274.366667 |
| 2 | 296 | 2015 | 1 | 1873.834459 | 4002 | 3 | 7.841216 | 45 | 56.487871 | 16720.409733 |
| 3 | 316 | 2015 | 1 | 843.329114 | 3908 | 1 | 1.746835 | 10 | 85.591320 | 27046.857143 |
| 4 | 486 | 2015 | 1 | 689.253086 | 1840 | 1 | 1.668724 | 5 | 24.777778 | 12042.000000 |
| 5 | 22 | 2015 | 1 | 1616.772727 | 3730 | 1 | 2.454545 | 11 | 934.168545 | 20551.707987 |
sample.reset_index().groupby(['cluster', 'last_purchase_year']).agg({'consumer_id':'count',
                                             'recency':['min','mean', 'max'],
                                             'frequency':['min','mean', 'max'],
                                             'monetary':['mean','sum']})
| consumer_id | recency | frequency | monetary | |||||||
|---|---|---|---|---|---|---|---|---|---|---|
| count | min | mean | max | min | mean | max | mean | sum | ||
| cluster | last_purchase_year | |||||||||
| 1 | 2005 | 27 | 3691 | 3848.851852 | 4012 | 1 | 1.444444 | 3 | 26.666667 | 720.000000 |
| 2006 | 57 | 3288 | 3325.403509 | 3577 | 1 | 1.596491 | 4 | 30.584795 | 1743.333333 | |
| 2007 | 182 | 2923 | 3095.049451 | 3272 | 1 | 1.538462 | 6 | 27.870421 | 5072.416667 | |
| 2008 | 128 | 2557 | 2687.835938 | 2907 | 1 | 1.585938 | 5 | 31.358073 | 4013.833333 | |
| 2009 | 126 | 2192 | 2340.039683 | 2550 | 1 | 1.603175 | 5 | 27.110053 | 3415.866667 | |
| 2010 | 142 | 1827 | 1999.823944 | 2179 | 1 | 1.704225 | 7 | 31.716549 | 4503.750000 | |
| 2011 | 42 | 1462 | 1655.428571 | 1815 | 1 | 2.476190 | 5 | 30.182540 | 1267.666667 | |
| 2012 | 17 | 1136 | 1307.705882 | 1407 | 2 | 2.647059 | 3 | 30.049020 | 510.833333 | |
| 2013 | 1 | 1055 | 1055.000000 | 1055 | 3 | 3.000000 | 3 | 26.666667 | 26.666667 | |
| 2 | 2005 | 13 | 3655 | 3824.461538 | 4002 | 4 | 6.846154 | 10 | 51.167430 | 665.176587 |
| 2006 | 13 | 3288 | 3378.384615 | 3585 | 4 | 6.615385 | 13 | 73.217878 | 951.832418 | |
| 2007 | 41 | 2923 | 3068.658537 | 3268 | 3 | 7.634146 | 18 | 63.403116 | 2599.527736 | |
| 2008 | 28 | 2557 | 2710.214286 | 2913 | 3 | 7.571429 | 28 | 72.479592 | 2029.428571 | |
| 2009 | 32 | 2192 | 2317.156250 | 2550 | 4 | 8.031250 | 45 | 72.810491 | 2329.935714 | |
| 2010 | 29 | 1827 | 1924.034483 | 2121 | 4 | 7.379310 | 14 | 63.486777 | 1841.116522 | |
| 2011 | 36 | 1462 | 1541.694444 | 1815 | 4 | 8.416667 | 19 | 48.145732 | 1733.246362 | |
| 2012 | 25 | 1096 | 1289.440000 | 1437 | 4 | 7.480000 | 14 | 43.983333 | 1099.583333 | |
| 2013 | 34 | 731 | 836.676471 | 1077 | 5 | 7.823529 | 16 | 41.220025 | 1401.480862 | |
| 2014 | 21 | 366 | 509.095238 | 702 | 5 | 9.761905 | 16 | 47.271538 | 992.702298 | |
| 2015 | 24 | 1 | 104.000000 | 339 | 5 | 7.875000 | 11 | 44.849139 | 1076.379329 | |
| 3 | 2005 | 1 | 3908 | 3908.000000 | 3908 | 2 | 2.000000 | 2 | 100.000000 | 100.000000 |
| 2006 | 6 | 3288 | 3355.833333 | 3478 | 1 | 1.333333 | 3 | 116.666667 | 700.000000 | |
| 2007 | 7 | 2933 | 3067.142857 | 3206 | 1 | 1.428571 | 2 | 121.428571 | 850.000000 | |
| 2008 | 3 | 2631 | 2632.000000 | 2633 | 1 | 1.000000 | 1 | 116.666667 | 350.000000 | |
| 2009 | 6 | 2213 | 2359.500000 | 2452 | 1 | 1.166667 | 2 | 130.833333 | 785.000000 | |
| 2010 | 7 | 1827 | 1931.714286 | 2086 | 1 | 2.285714 | 4 | 109.761905 | 768.333333 | |
| 2011 | 23 | 1462 | 1597.130435 | 1820 | 1 | 1.782609 | 5 | 99.362319 | 2285.333333 | |
| 2012 | 45 | 1096 | 1211.911111 | 1435 | 1 | 1.555556 | 6 | 79.472222 | 3576.250000 | |
| 2013 | 66 | 731 | 848.803030 | 1071 | 1 | 1.863636 | 7 | 80.297619 | 5299.642857 | |
| 2014 | 58 | 366 | 497.224138 | 689 | 1 | 2.362069 | 10 | 76.004310 | 4408.250000 | |
| 2015 | 94 | 1 | 98.659574 | 349 | 1 | 1.436170 | 7 | 84.298379 | 7924.047619 | |
| 4 | 2010 | 1 | 1840 | 1840.000000 | 1840 | 1 | 1.000000 | 1 | 20.000000 | 20.000000 |
| 2011 | 41 | 1462 | 1550.609756 | 1794 | 1 | 1.048780 | 3 | 22.804878 | 935.000000 | |
| 2012 | 96 | 1096 | 1193.739583 | 1401 | 1 | 1.510417 | 5 | 22.796007 | 2188.416667 | |
| 2013 | 105 | 731 | 869.619048 | 1080 | 1 | 1.723810 | 5 | 26.074603 | 2737.833333 | |
| 2014 | 100 | 366 | 486.470000 | 686 | 1 | 1.920000 | 5 | 25.011667 | 2501.166667 | |
| 2015 | 143 | 1 | 104.937063 | 359 | 1 | 1.741259 | 5 | 25.591492 | 3659.583333 | |
| 5 | 2005 | 3 | 3664 | 3690.666667 | 3730 | 1 | 2.000000 | 4 | 952.500000 | 2857.500000 |
| 2006 | 1 | 3363 | 3363.000000 | 3363 | 2 | 2.000000 | 2 | 340.000000 | 340.000000 | |
| 2008 | 4 | 2616 | 2712.250000 | 2834 | 1 | 1.250000 | 2 | 679.431250 | 2717.725000 | |
| 2010 | 1 | 1884 | 1884.000000 | 1884 | 1 | 1.000000 | 1 | 554.320000 | 554.320000 | |
| 2011 | 2 | 1462 | 1549.500000 | 1637 | 7 | 9.000000 | 11 | 1606.506494 | 3213.012987 | |
| 2012 | 1 | 1096 | 1096.000000 | 1096 | 1 | 1.000000 | 1 | 1080.000000 | 1080.000000 | |
| 2013 | 3 | 752 | 840.666667 | 1011 | 1 | 1.333333 | 2 | 1434.980000 | 4304.940000 | |
| 2014 | 3 | 367 | 513.333333 | 618 | 1 | 4.333333 | 10 | 800.000000 | 2400.000000 | |
| 2015 | 4 | 1 | 36.000000 | 97 | 1 | 1.000000 | 1 | 771.052500 | 3084.210000 | |
sample.reset_index().groupby(['last_purchase_year', 'cluster']).agg({'consumer_id':'count',
                                             'recency':['mean'],
                                             'frequency':['mean',],
                                             'monetary':['mean','sum']}).transform(lambda col : (col-col.min())/(col.max()-col.min()), axis=1).plot(figsize=(24,6))
<AxesSubplot:xlabel='last_purchase_year,cluster'>

norm_sample = sample.reset_index().groupby(['last_purchase_year', 'cluster']).agg({'consumer_id':'count',
                                             # 'recency':['mean'],
                                             'frequency':['mean',],
                                             'monetary':['mean', 'sum']})
norm_sample = (norm_sample - norm_sample.min())/(norm_sample.max() - norm_sample.min())
norm_sample.columns = ["_".join(a) for a in norm_sample.columns.to_flat_index()]
norm_sample.reset_index()
| last_purchase_year | cluster | consumer_id_count | frequency_mean | monetary_mean | monetary_sum | |
|---|---|---|---|---|---|---|
| 0 | 2005 | 1 | 0.143646 | 0.050725 | 0.004202 | 0.088562 |
| 1 | 2005 | 2 | 0.066298 | 0.667224 | 0.019645 | 0.081626 |
| 2 | 2005 | 3 | 0.000000 | 0.114130 | 0.050425 | 0.010121 |
| 3 | 2005 | 5 | 0.011050 | 0.114130 | 0.587769 | 0.358993 |
| 4 | 2006 | 1 | 0.309392 | 0.068078 | 0.006672 | 0.218032 |
| 5 | 2006 | 2 | 0.066298 | 0.640886 | 0.033544 | 0.117893 |
| 6 | 2006 | 3 | 0.027624 | 0.038043 | 0.060931 | 0.086032 |
| 7 | 2006 | 5 | 0.000000 | 0.114130 | 0.201701 | 0.040486 |
| 8 | 2007 | 1 | 1.000000 | 0.061455 | 0.004961 | 0.639219 |
| 9 | 2007 | 2 | 0.220994 | 0.757158 | 0.027358 | 0.326355 |
| 10 | 2007 | 3 | 0.033149 | 0.048913 | 0.063932 | 0.105009 |
| 11 | 2008 | 1 | 0.701657 | 0.066873 | 0.007159 | 0.505290 |
| 12 | 2008 | 2 | 0.149171 | 0.750000 | 0.033079 | 0.254228 |
| 13 | 2008 | 3 | 0.011050 | 0.000000 | 0.060931 | 0.041751 |
| 14 | 2008 | 5 | 0.016575 | 0.028533 | 0.415650 | 0.341309 |
| 15 | 2009 | 1 | 0.690608 | 0.068841 | 0.004482 | 0.429636 |
| 16 | 2009 | 2 | 0.171271 | 0.802480 | 0.033287 | 0.292247 |
| 17 | 2009 | 3 | 0.027624 | 0.019022 | 0.069860 | 0.096786 |
| 18 | 2010 | 1 | 0.779006 | 0.080374 | 0.007385 | 0.567273 |
| 19 | 2010 | 2 | 0.154696 | 0.728073 | 0.027410 | 0.230403 |
| 20 | 2010 | 3 | 0.033149 | 0.146739 | 0.056578 | 0.094677 |
| 21 | 2010 | 4 | 0.000000 | 0.000000 | 0.000000 | 0.000000 |
| 22 | 2010 | 5 | 0.000000 | 0.000000 | 0.336790 | 0.067601 |
| 23 | 2011 | 1 | 0.226519 | 0.168478 | 0.006418 | 0.157852 |
| 24 | 2011 | 2 | 0.193370 | 0.846467 | 0.017741 | 0.216756 |
| 25 | 2011 | 3 | 0.121547 | 0.089319 | 0.050023 | 0.286604 |
| 26 | 2011 | 4 | 0.220994 | 0.005567 | 0.001768 | 0.115763 |
| 27 | 2011 | 5 | 0.005525 | 0.913043 | 1.000000 | 0.403972 |
| 28 | 2012 | 1 | 0.088398 | 0.187980 | 0.006334 | 0.062099 |
| 29 | 2012 | 2 | 0.132597 | 0.739565 | 0.015117 | 0.136586 |
| 30 | 2012 | 3 | 0.243094 | 0.063406 | 0.037486 | 0.449928 |
| 31 | 2012 | 4 | 0.524862 | 0.058254 | 0.001762 | 0.274343 |
| 32 | 2012 | 5 | 0.000000 | 0.000000 | 0.668135 | 0.134109 |
| 33 | 2013 | 1 | 0.000000 | 0.228261 | 0.004202 | 0.000843 |
| 34 | 2013 | 2 | 0.182320 | 0.778772 | 0.013375 | 0.174781 |
| 35 | 2013 | 3 | 0.359116 | 0.098567 | 0.038007 | 0.667967 |
| 36 | 2013 | 4 | 0.574586 | 0.082609 | 0.003829 | 0.343853 |
| 37 | 2013 | 5 | 0.011050 | 0.038043 | 0.891884 | 0.542120 |
| 38 | 2014 | 2 | 0.110497 | 1.000000 | 0.017190 | 0.123064 |
| 39 | 2014 | 3 | 0.314917 | 0.155454 | 0.035300 | 0.555190 |
| 40 | 2014 | 4 | 0.546961 | 0.105000 | 0.003159 | 0.313911 |
| 41 | 2014 | 5 | 0.011050 | 0.380435 | 0.491646 | 0.301112 |
| 42 | 2015 | 2 | 0.127072 | 0.784647 | 0.015663 | 0.133650 |
| 43 | 2015 | 3 | 0.513812 | 0.049780 | 0.040528 | 1.000000 |
| 44 | 2015 | 4 | 0.784530 | 0.084600 | 0.003524 | 0.460471 |
| 45 | 2015 | 5 | 0.016575 | 0.000000 | 0.473400 | 0.387676 |
sns.catplot(x='last_purchase_year', col='cluster', col_wrap=5, kind='count',ci='sd', data=sample.reset_index())
<seaborn.axisgrid.FacetGrid at 0x116c28814580>

sns.catplot(x='last_purchase_year', y='monetary', col='cluster',col_wrap=5, kind='box',ci='sd', data=sample).set( ylim=(0,2000))
<seaborn.axisgrid.FacetGrid at 0x116c26b42310>

sns.catplot(x='last_purchase_year', y='monetary', col='cluster',col_wrap=5, kind='box',ci='sd', data=sample).set( ylim=(0,200))
<seaborn.axisgrid.FacetGrid at 0x116c26bdc5e0>

sns.catplot(x='last_purchase_year', y='frequency', col='cluster',col_wrap=5, kind='box',ci='sd', data=sample).set( ylim=(0,20))
<seaborn.axisgrid.FacetGrid at 0x116c28062a60>

sns.catplot(x='last_purchase_year', y='recency', col='cluster',col_wrap=5, kind='box',ci='sd', data=sample)
<seaborn.axisgrid.FacetGrid at 0x116c289c0280>

sample_cp = sample.copy()
sample_cp['recency'] = sample['recency']-sample.groupby('last_purchase_year')['recency'].transform('min')
sns.catplot(x='last_purchase_year', y='recency', col='cluster',col_wrap=5, kind='box',ci='sd', data=sample_cp)
<seaborn.axisgrid.FacetGrid at 0x116c283741c0>

sample
| monetary | last_purchase_year | recency | frequency | cluster | |
|---|---|---|---|---|---|
| consumer_id | |||||
| 134880 | 10.0 | 2009 | 2192 | 1 | 1 |
| 214990 | 30.0 | 2013 | 731 | 1 | 4 |
| 77150 | 30.0 | 2007 | 3102 | 1 | 1 |
| 88000 | 40.0 | 2007 | 2961 | 1 | 1 |
| 163970 | 29.0 | 2014 | 437 | 5 | 4 |
| ... | ... | ... | ... | ... | ... |
| 181050 | 10.0 | 2012 | 1188 | 1 | 4 |
| 144260 | 20.0 | 2010 | 1990 | 1 | 1 |
| 155540 | 20.0 | 2011 | 1688 | 1 | 4 |
| 61350 | 103.0 | 2011 | 1476 | 10 | 2 |
| 191070 | 12.5 | 2012 | 1097 | 2 | 4 |
1842 rows × 5 columns


