Hypothesis Testing
Contents
Hypothesis Testing#
Synopsis#
Null Hypothesis Significance testing (NHST)
Proof by contradiction
Least important : Only useful in come context
Methodology
Apparent difference in distribution
Assume no difference
Test Statistics
Calculate P-Value
Comment
Note
We make modelling decisions on
Null Hypothesis
Test Statistic ( Choosing a 1-sided or a 2-sided test)
import numpy as np
import scipy as sp
import scipy.stats as stats
import matplotlib as mpl
import matplotlib.pyplot as plt
from ipywidgets import interact, interactive, fixed
import ipywidgets as widgets
import pandas as pd
from IPython.display import display, display_html
import bqplot
import first

from bqplot import LinearScale, Hist, Figure, Axis, ColorScale

from bqplot import pyplot as pltbq
# import seaborn as sns
# seed the random number generator so we all get the same results
np.random.seed(17)

# some nice colors from http://colorbrewer2.org/
COLOR1 = '#7fc97f'
COLOR2 = '#beaed4'
COLOR3 = '#fdc086'
COLOR4 = '#ffff99'
COLOR5 = '#386cb0'

mpl.rcParams['figure.figsize'] = (8.0, 9.0)
%matplotlib inline
Part 1#
Suppose u observe apparent difference between 2 groups
Check if it might be due to chance
live, firsts, others = first.MakeFrames()
firsts.info()
<class 'pandas.core.frame.DataFrame'>
Int64Index: 4413 entries, 0 to 13588
Columns: 244 entries, caseid to totalwgt_lb
dtypes: float64(171), int64(73)
memory usage: 8.2 MB
firsts.head()
| caseid | pregordr | howpreg_n | howpreg_p | moscurrp | nowprgdk | pregend1 | pregend2 | nbrnaliv | multbrth | ... | laborfor_i | religion_i | metro_i | basewgt | adj_mod_basewgt | finalwgt | secu_p | sest | cmintvw | totalwgt_lb | |
|---|---|---|---|---|---|---|---|---|---|---|---|---|---|---|---|---|---|---|---|---|---|
| 0 | 1 | 1 | NaN | NaN | NaN | NaN | 6.0 | NaN | 1.0 | NaN | ... | 0 | 0 | 0 | 3410.389399 | 3869.349602 | 6448.271112 | 2 | 9 | NaN | 8.8125 |
| 2 | 2 | 1 | NaN | NaN | NaN | NaN | 5.0 | NaN | 3.0 | 5.0 | ... | 0 | 0 | 0 | 7226.301740 | 8567.549110 | 12999.542264 | 2 | 12 | NaN | 9.1250 |
| 5 | 6 | 1 | NaN | NaN | NaN | NaN | 6.0 | NaN | 1.0 | NaN | ... | 0 | 0 | 0 | 4870.926435 | 5325.196999 | 8874.440799 | 1 | 23 | NaN | 8.5625 |
| 8 | 7 | 1 | NaN | NaN | NaN | NaN | 5.0 | NaN | 1.0 | NaN | ... | 0 | 0 | 0 | 3409.579565 | 3787.539000 | 6911.879921 | 2 | 14 | NaN | 7.5625 |
| 10 | 12 | 1 | NaN | NaN | NaN | NaN | 5.0 | NaN | 1.0 | NaN | ... | 0 | 0 | 0 | 3612.781968 | 4146.013572 | 6909.331618 | 1 | 31 | NaN | 7.8125 |
5 rows × 244 columns
firsts.describe()
| caseid | pregordr | howpreg_n | howpreg_p | moscurrp | nowprgdk | pregend1 | pregend2 | nbrnaliv | multbrth | ... | laborfor_i | religion_i | metro_i | basewgt | adj_mod_basewgt | finalwgt | secu_p | sest | cmintvw | totalwgt_lb | |
|---|---|---|---|---|---|---|---|---|---|---|---|---|---|---|---|---|---|---|---|---|---|
| count | 4413.000000 | 4413.000000 | 0.0 | 0.0 | 0.0 | 0.0 | 4413.000000 | 5.000000 | 4412.000000 | 52.000000 | ... | 4413.000000 | 4413.000000 | 4413.0 | 4413.000000 | 4413.000000 | 4413.000000 | 4413.000000 | 4413.000000 | 0.0 | 4363.000000 |
| mean | 6238.983005 | 1.330387 | NaN | NaN | NaN | NaN | 5.764786 | 5.000000 | 1.014733 | 1.692308 | ... | 0.000906 | 0.003626 | 0.0 | 4181.313797 | 5347.029828 | 8143.762911 | 1.489916 | 43.808294 | NaN | 7.201094 |
| std | 3651.545931 | 0.715439 | NaN | NaN | NaN | NaN | 0.431071 | 2.236068 | 0.153581 | 1.528019 | ... | 0.030096 | 0.063770 | 0.0 | 3539.367216 | 4991.010212 | 8270.404870 | 0.499955 | 24.116585 | NaN | 1.420573 |
| min | 1.000000 | 1.000000 | NaN | NaN | NaN | NaN | 1.000000 | 1.000000 | 1.000000 | 1.000000 | ... | 0.000000 | 0.000000 | 0.0 | 64.577101 | 71.201194 | 118.656790 | 1.000000 | 1.000000 | NaN | 0.125000 |
| 25% | 3047.000000 | 1.000000 | NaN | NaN | NaN | NaN | 6.000000 | 6.000000 | 1.000000 | 1.000000 | ... | 0.000000 | 0.000000 | 0.0 | 2418.005561 | 2876.683738 | 4033.606004 | 1.000000 | 24.000000 | NaN | 6.437500 |
| 50% | 6179.000000 | 1.000000 | NaN | NaN | NaN | NaN | 6.000000 | 6.000000 | 1.000000 | 1.000000 | ... | 0.000000 | 0.000000 | 0.0 | 3409.970503 | 4196.796883 | 6456.845037 | 1.000000 | 45.000000 | NaN | 7.312500 |
| 75% | 9415.000000 | 1.000000 | NaN | NaN | NaN | NaN | 6.000000 | 6.000000 | 1.000000 | 1.000000 | ... | 0.000000 | 0.000000 | 0.0 | 4870.474384 | 5862.064708 | 9496.575715 | 2.000000 | 65.000000 | NaN | 8.000000 |
| max | 12571.000000 | 9.000000 | NaN | NaN | NaN | NaN | 6.000000 | 6.000000 | 5.000000 | 5.000000 | ... | 1.000000 | 2.000000 | 0.0 | 99707.832014 | 157143.686687 | 261879.953864 | 2.000000 | 84.000000 | NaN | 15.437500 |
8 rows × 244 columns
Review variables
pregnancy length
birth weight
def test_statistic(data):
    grp1, grp2 = data
    test_stat = abs(grp1.mean() - grp2.mean())
    return test_stat
grp1 , grp2 = firsts.prglngth, others.prglngth
actual = test_statistic((grp1 , grp2))
actual
0.07803726677754952
grp2
1        39
3        39
4        39
6        40
7        42
         ..
13572    39
13574    39
13579    39
13591    39
13592    39
Name: prglngth, Length: 4735, dtype: int64
n, m = len(grp1), len(grp2)
pool = np.hstack((grp1, grp2))
pool
array([39, 39, 38, ..., 39, 39, 39])
def run_model():
    np.random.shuffle(pool)
    data = pool[:n], pool[n:]
    return data
run_model()
(array([30, 35, 41, ..., 40, 39, 39]), array([39, 39, 39, ..., 39, 38, 40]))
test_statistic(run_model())
0.04892370650121336
test_stats = np.array([test_statistic(run_model()) for i in range(1000)])
plt.axvline(actual, linewidth=3, color='0.8')
plt.hist(test_stats, color=COLOR5)
plt.xlabel('Difference in means')
plt.ylabel('count')
plt.show()
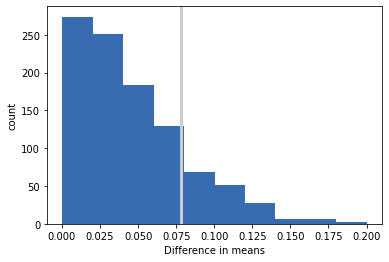
pvalue = sum(test_stats>=actual)/len(test_stats)
pvalue
0.178
Probability that test statistic under null hypothesis exceeds the actual value
Part 2#
Framework#
class HypothesisTest(object):

    def __init__(self, data):
        """ Initiailizes

        data: data in whatever form is relevant
        """

        self.data = data
        self.test_stats = None
        self.actual = self.test_statistics(data)
        self.make_model()

    def pvalue(self, iters=1000):
        """ Computes distribution of the test statistics

        iters: number of iterations
        returns: float p-value
        """

        self.test_stats = np.array([self.test_statistics(self.run_model()) for _ in range(iters)])
        count = sum(self.test_stats >= actual)
        return count/iters


    def plot_hist(self):
        plt.axvline(self.actual, linewidth=3, color='0.8')
        plt.hist(self.test_stats, color=COLOR4)
        plt.xlabel('Test Statistics')
        plt.ylabel('count')
        plt.show()


    def max_teststat(self):
        """
        Returns the largest test statistics seen during simulations
        """
        return max(self.test_stats)


    def test_statistics(self, data):
        """ Computes the test statistics

        data: data in whatever form is relative_difference_by_female
        """

        raise UnimplementedMethodException()


    def make_model(self):
        """
        Build a model of null hypothesis
        """

        pass

    def run_model(self):
        """
        Run the model of the null hypothesis

        returns: simulated data
        """

        raise UnimplementedMethodException()
DiffMeansPermute#
class DiffMeansPermute(HypothesisTest):

    def test_statistics(self, data):
        """
        Computes the test statistics

        data: data in whatever form is relevant for the diff
        """

        grp1, grp2 = data
        test_stat = abs(grp1.mean() - grp2.mean())
        return test_stat

    def make_model(self):
        grp1, grp2  = self.data
        self.n, self.m = len(grp1), len(grp2)
        self.pool = np.hstack((grp1, grp2))


    def run_model(self):
        """
        Run the model of the null hypothesis

        returns: simulated data
        """

        np.random.shuffle(self.pool)
        data = self.pool[:self.n], self.pool[self.n:]
        return data
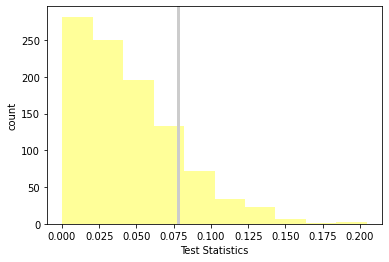
data = (firsts.prglngth, others.prglngth)

ht = DiffMeansPermute(data)

p_value = ht.pvalue(iters=1000)
p_value, ht.actual, ht.max_teststat()
(0.164, 0.07803726677754952, 0.20456044359674053)
ht.plot_hist()
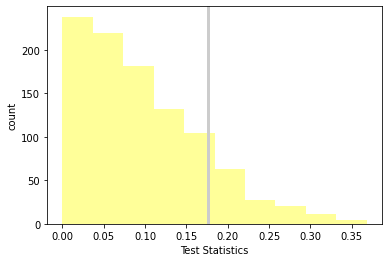
DiffStdPermute#
class DiffStdPermute(DiffMeansPermute):

    def test_statistics(self, data):
        grp1, grp2 = data
        test_stat = abs(grp1.std() - grp2.std())
        return test_stat
data = (firsts.prglngth, others.prglngth)

ht = DiffStdPermute(data)

p_value = ht.pvalue(iters=1000)
p_value, ht.actual, ht.max_teststat()
(0.523, 0.17604906422948297, 0.3682700930119429)
ht.plot_hist()
Applying on Birth Weights#
data = (firsts.totalwgt_lb.dropna(), others.totalwgt_lb.dropna())

ht = DiffMeansPermute(data)

p_value = ht.pvalue(iters=1000)

p_value, ht.actual, ht.max_teststat()
(0.004, 0.12476118453549034, 0.08186367252086946)
data
(0        8.8125
 2        9.1250
 5        8.5625
 8        7.5625
 10       7.8125
           ...
 13576    6.4375
 13578    6.0000
 13581    6.3750
 13584    6.3750
 13588    6.1875
 Name: totalwgt_lb, Length: 4363, dtype: float64,
 1        7.8750
 3        7.0000
 4        6.1875
 6        9.5625
 7        8.3750
           ...
 13572    5.8125
 13574    6.1250
 13579    7.0000
 13591    7.5000
 13592    7.5000
 Name: totalwgt_lb, Length: 4675, dtype: float64)