Managerial Segmentation
Contents
Managerial Segmentation#
import pandas as pd
import numpy as np
import scipy as sp
import matplotlib.pyplot as plt
import seaborn as sns
import datetime as dt
from sklearn.cluster import AgglomerativeClustering
from scipy.cluster.hierarchy import dendrogram, linkage
from sklearn.pipeline import Pipeline, make_pipeline
from sklearn.preprocessing import StandardScaler, RobustScaler, FunctionTransformer
Read Dataset#
df = pd.read_csv("W106_purchases.txt", sep='\t', names=['consumer_id','purchase_amount', 'date_of_purchase'], parse_dates=['date_of_purchase'] ); df.head()
| consumer_id | purchase_amount | date_of_purchase | |
|---|---|---|---|
| 0 | 760 | 25.0 | 2009-11-06 |
| 1 | 860 | 50.0 | 2012-09-28 |
| 2 | 1200 | 100.0 | 2005-10-25 |
| 3 | 1420 | 50.0 | 2009-07-09 |
| 4 | 1940 | 70.0 | 2013-01-25 |
df.describe(include='all')
/tmp/ipykernel_36820/2884002236.py:1: FutureWarning: Treating datetime data as categorical rather than numeric in `.describe` is deprecated and will be removed in a future version of pandas. Specify `datetime_is_numeric=True` to silence this warning and adopt the future behavior now.
  df.describe(include='all')
| consumer_id | purchase_amount | date_of_purchase | |
|---|---|---|---|
| count | 51243.000000 | 51243.000000 | 51243 |
| unique | NaN | NaN | 1879 |
| top | NaN | NaN | 2013-12-31 00:00:00 |
| freq | NaN | NaN | 864 |
| first | NaN | NaN | 2005-01-02 00:00:00 |
| last | NaN | NaN | 2015-12-31 00:00:00 |
| mean | 108934.547938 | 62.337195 | NaN |
| std | 67650.610139 | 156.606801 | NaN |
| min | 10.000000 | 5.000000 | NaN |
| 25% | 57720.000000 | 25.000000 | NaN |
| 50% | 102440.000000 | 30.000000 | NaN |
| 75% | 160525.000000 | 60.000000 | NaN |
| max | 264200.000000 | 4500.000000 | NaN |
df['year_of_purchase'] = df['date_of_purchase'].dt.year
max_date = df['date_of_purchase'].max() + dt.timedelta(days=1); max_date
Timestamp('2016-01-01 00:00:00')
df['days_since'] = (max_date - df['date_of_purchase']).dt.days
df.head()
| consumer_id | purchase_amount | date_of_purchase | year_of_purchase | days_since | |
|---|---|---|---|---|---|
| 0 | 760 | 25.0 | 2009-11-06 | 2009 | 2247 |
| 1 | 860 | 50.0 | 2012-09-28 | 2012 | 1190 |
| 2 | 1200 | 100.0 | 2005-10-25 | 2005 | 3720 |
| 3 | 1420 | 50.0 | 2009-07-09 | 2009 | 2367 |
| 4 | 1940 | 70.0 | 2013-01-25 | 2013 | 1071 |
Segmentation#
consumer_df = df.groupby('consumer_id').agg(recency=('days_since', 'min'),
                                            frequency=('date_of_purchase', 'count'),
                                            monetary=('purchase_amount', 'mean'),
                                            first_purchase=('days_since', 'max'),
                                            first_purchase_date=('date_of_purchase', 'min'),
                                            first_purchase_year=('year_of_purchase', 'min'),
                                            last_purchase_date=('date_of_purchase', 'max'),
                                            last_purchase_year=('year_of_purchase', 'max'),
                                           ); consumer_df.head()
| recency | frequency | monetary | first_purchase | first_purchase_date | first_purchase_year | last_purchase_date | last_purchase_year | |
|---|---|---|---|---|---|---|---|---|
| consumer_id | ||||||||
| 10 | 3829 | 1 | 30.000000 | 3829 | 2005-07-08 | 2005 | 2005-07-08 | 2005 |
| 80 | 343 | 7 | 71.428571 | 3751 | 2005-09-24 | 2005 | 2015-01-23 | 2015 |
| 90 | 758 | 10 | 115.800000 | 3783 | 2005-08-23 | 2005 | 2013-12-04 | 2013 |
| 120 | 1401 | 1 | 20.000000 | 1401 | 2012-03-01 | 2012 | 2012-03-01 | 2012 |
| 130 | 2970 | 2 | 50.000000 | 3710 | 2005-11-04 | 2005 | 2007-11-14 | 2007 |
consumer_df.info()
<class 'pandas.core.frame.DataFrame'>
Int64Index: 18417 entries, 10 to 264200
Data columns (total 8 columns):
 #   Column               Non-Null Count  Dtype
---  ------               --------------  -----
 0   recency              18417 non-null  int64
 1   frequency            18417 non-null  int64
 2   monetary             18417 non-null  float64
 3   first_purchase       18417 non-null  int64
 4   first_purchase_date  18417 non-null  datetime64[ns]
 5   first_purchase_year  18417 non-null  int64
 6   last_purchase_date   18417 non-null  datetime64[ns]
 7   last_purchase_year   18417 non-null  int64
dtypes: datetime64[ns](2), float64(1), int64(5)
memory usage: 1.3 MB
consumer_df.describe()
| recency | frequency | monetary | first_purchase | first_purchase_year | last_purchase_year | |
|---|---|---|---|---|---|---|
| count | 18417.000000 | 18417.000000 | 18417.000000 | 18417.000000 | 18417.000000 | 18417.000000 |
| mean | 1253.037900 | 2.782375 | 57.792985 | 1984.009882 | 2009.925178 | 2011.906825 |
| std | 1081.437868 | 2.936888 | 154.360109 | 1133.405441 | 3.068690 | 2.914005 |
| min | 1.000000 | 1.000000 | 5.000000 | 1.000000 | 2005.000000 | 2005.000000 |
| 25% | 244.000000 | 1.000000 | 21.666667 | 988.000000 | 2007.000000 | 2010.000000 |
| 50% | 1070.000000 | 2.000000 | 30.000000 | 2087.000000 | 2010.000000 | 2013.000000 |
| 75% | 2130.000000 | 3.000000 | 50.000000 | 2992.000000 | 2013.000000 | 2015.000000 |
| max | 4014.000000 | 45.000000 | 4500.000000 | 4016.000000 | 2015.000000 | 2015.000000 |
consumer_df['segment'] = np.nan
# consumer_df.loc[consumer_df['recency'] <=365  , 'segment'] = 'active'
consumer_df.loc[(consumer_df['recency'] <=365)  & (consumer_df['monetary'] >= 100), 'segment'] = 'active high'
consumer_df.loc[(consumer_df['recency'] <=365)  & (consumer_df['monetary'] < 100), 'segment'] = 'active low'
consumer_df.loc[(consumer_df['recency'] <=365) & (consumer_df['first_purchase'] <=365) & (consumer_df['monetary'] >= 100) , 'segment'] = 'new active high'
consumer_df.loc[(consumer_df['recency'] <=365) & (consumer_df['first_purchase'] <=365) & (consumer_df['monetary'] < 100) , 'segment'] = 'new active low'
consumer_df.loc[(consumer_df['recency']>365) & (consumer_df['recency']<=2*365) & (consumer_df['monetary'] >= 100), 'segment'] = 'warm high'
consumer_df.loc[(consumer_df['recency']>365) & (consumer_df['recency']<=2*365) & (consumer_df['monetary'] < 100), 'segment'] = 'warm low'
consumer_df.loc[(consumer_df['recency']>365) & (consumer_df['recency']<=2*365) & (consumer_df['first_purchase'] <=2*365) & (consumer_df['monetary'] >= 100) , 'segment'] = 'new warm high'
consumer_df.loc[(consumer_df['recency']>365) & (consumer_df['recency']<=2*365) & (consumer_df['first_purchase'] <=2*365) & (consumer_df['monetary'] < 100) , 'segment'] = 'new warm low'
consumer_df.loc[(consumer_df['recency']>2*365) & (consumer_df['recency']<=3*365), 'segment'] = 'cold'
consumer_df.loc[(consumer_df['recency']>3*365), 'segment'] = 'inactive'
# consumer_df.groupby('segment').count()
consumer_df['segment'].value_counts(dropna=False)
inactive           9158
active low         3313
cold               1903
new active low     1249
warm low            901
new warm low        822
active high         573
new active high     263
warm high           119
new warm high       116
Name: segment, dtype: int64
consumer_df['segment'].value_counts(dropna=False).sum()
18417
segment_df = consumer_df.groupby('segment').agg(size=('recency', 'count'),
                                   recency_min=('recency', 'min'),
                                   recency=('recency', 'mean'),
                                   recency_max=('recency', 'max'),
                                   frequency_min=('frequency', 'min'),
                                   frequency=('frequency', 'mean'),
                                   frequency_max=('frequency', 'max'),
                                   monetary_min=('monetary', 'min'),
                                   monetary=('monetary', 'mean'),
                                   monetary_max=('monetary', 'max'),
                                   first_purchase=('first_purchase', 'max'),
                                   first_purchase_date=('first_purchase_date', 'min'),
                                   first_purchase_year=('first_purchase_year', 'min'),
                                   last_purchase_date=('last_purchase_date', 'max'),
                                   last_purchase_year=('last_purchase_year', 'max')
                                  ).sort_values(by=['last_purchase_year', 'first_purchase_year','monetary'], ascending=[False, False, False])
segment_df['revenue'] = np.round(segment_df['size']*segment_df['monetary'], 0)
segment_df
| size | recency_min | recency | recency_max | frequency_min | frequency | frequency_max | monetary_min | monetary | monetary_max | first_purchase | first_purchase_date | first_purchase_year | last_purchase_date | last_purchase_year | revenue | |
|---|---|---|---|---|---|---|---|---|---|---|---|---|---|---|---|---|
| segment | ||||||||||||||||
| new active high | 263 | 1 | 82.372624 | 360 | 1 | 1.015209 | 2 | 100.0 | 283.381027 | 4500.000000 | 360 | 2015-01-06 | 2015 | 2015-12-31 | 2015 | 74529.0 |
| new active low | 1249 | 1 | 85.542034 | 359 | 1 | 1.052042 | 11 | 5.0 | 33.704697 | 90.000000 | 359 | 2015-01-07 | 2015 | 2015-12-31 | 2015 | 42097.0 |
| active high | 573 | 1 | 88.820244 | 344 | 2 | 5.888307 | 19 | 100.0 | 240.045740 | 4500.000000 | 4010 | 2005-01-08 | 2005 | 2015-12-31 | 2015 | 137546.0 |
| active low | 3313 | 1 | 108.361002 | 359 | 2 | 5.935406 | 45 | 5.0 | 40.724525 | 99.000000 | 4012 | 2005-01-06 | 2005 | 2015-12-31 | 2015 | 134920.0 |
| new warm high | 116 | 366 | 476.060345 | 701 | 1 | 1.060345 | 4 | 100.0 | 302.036379 | 4000.000000 | 707 | 2014-01-24 | 2014 | 2014-12-31 | 2014 | 35036.0 |
| new warm low | 822 | 366 | 513.996350 | 720 | 1 | 1.042579 | 3 | 5.0 | 33.374290 | 90.000000 | 720 | 2014-01-11 | 2014 | 2014-12-31 | 2014 | 27434.0 |
| warm high | 119 | 366 | 455.126050 | 665 | 2 | 4.714286 | 14 | 100.0 | 327.407457 | 4000.000000 | 4004 | 2005-01-14 | 2005 | 2014-12-31 | 2014 | 38961.0 |
| warm low | 901 | 366 | 474.377358 | 707 | 2 | 4.531632 | 20 | 5.0 | 38.591926 | 96.428571 | 4011 | 2005-01-07 | 2005 | 2014-12-31 | 2014 | 34771.0 |
| cold | 1903 | 731 | 857.781398 | 1087 | 1 | 2.303205 | 20 | 5.0 | 51.739893 | 2000.000000 | 4016 | 2005-01-02 | 2005 | 2013-12-31 | 2013 | 98461.0 |
| inactive | 9158 | 1096 | 2178.110832 | 4014 | 1 | 1.814479 | 23 | 5.0 | 48.112771 | 3043.750000 | 4016 | 2005-01-02 | 2005 | 2012-12-31 | 2012 | 440617.0 |
consumer_df['last_purchase_date'].max()
Timestamp('2015-12-31 00:00:00')
def get_segment_summary(consumer_df):
    if 'revenue' in consumer_df.columns:
        segment_df = consumer_df.groupby('segment').agg(size=('recency', 'count'),
                                       revenue_today=('revenue', 'sum'),
                                       avg_revenue_today=('revenue', 'mean'),
                                       revenue_till_date=('revenue_till_date', 'sum'),
                                       avg_revenue_till_date=('revenue_till_date', 'mean'),
                                       recency_min=('recency', 'min'),
                                       recency=('recency', 'mean'),
                                       recency_max=('recency', 'max'),
                                       frequency_min=('frequency', 'min'),
                                       frequency=('frequency', 'mean'),
                                       frequency_max=('frequency', 'max'),
                                       monetary_min=('monetary', 'min'),
                                       monetary=('monetary', 'mean'),
                                       monetary_max=('monetary', 'max'),
                                       first_purchase=('first_purchase', 'max'),
                                       first_purchase_date=('first_purchase_date', 'min'),
                                       first_purchase_year=('first_purchase_year', 'min'),
                                       last_purchase_date=('last_purchase_date', 'max'),
                                       last_purchase_year=('last_purchase_year', 'max')
                                      ).sort_values(by=['last_purchase_year', 'first_purchase_year','monetary'], ascending=[False, False, False])
    else:
        segment_df = consumer_df.groupby('segment').agg(size=('recency', 'count'),
                                       revenue_till_date=('revenue_till_date', 'sum'),
                                       avg_revenue_till_date=('revenue_till_date', 'mean'),
                                       recency_min=('recency', 'min'),
                                       recency=('recency', 'mean'),
                                       recency_max=('recency', 'max'),
                                       frequency_min=('frequency', 'min'),
                                       frequency=('frequency', 'mean'),
                                       frequency_max=('frequency', 'max'),
                                       monetary_min=('monetary', 'min'),
                                       monetary=('monetary', 'mean'),
                                       monetary_max=('monetary', 'max'),
                                       first_purchase=('first_purchase', 'max'),
                                       first_purchase_date=('first_purchase_date', 'min'),
                                       first_purchase_year=('first_purchase_year', 'min'),
                                       last_purchase_date=('last_purchase_date', 'max'),
                                       last_purchase_year=('last_purchase_year', 'max')
                                      ).sort_values(by=['last_purchase_year', 'first_purchase_year','monetary'], ascending=[False, False, False])
    return segment_df
def get_consumer_df(df, offset=0):
    df = df.copy()
    df = df[df['days_since']>offset]
    consumer_df = df.groupby('consumer_id').agg(recency=('days_since', 'min'),
                                            frequency=('date_of_purchase', 'count'),
                                            monetary=('purchase_amount', 'mean'),
                                            revenue_till_date=('purchase_amount', 'sum'),
                                            first_purchase=('days_since', 'max'),
                                            first_purchase_date=('date_of_purchase', 'min'),
                                            first_purchase_year=('year_of_purchase', 'min'),
                                            last_purchase_date=('date_of_purchase', 'max'),
                                            last_purchase_year=('year_of_purchase', 'max'),
                                           ); consumer_df.head()
    consumer_df['recency'] = consumer_df['recency']  - offset
    consumer_df['first_purchase'] = consumer_df['first_purchase'] - offset
    consumer_df['segment'] = np.nan
    rec_filter  = consumer_df['recency']
    first_purchase_filter = consumer_df['first_purchase']
    consumer_df.loc[(rec_filter <=365)  & (consumer_df['monetary'] >= 100), 'segment'] = 'active high'
    consumer_df.loc[(rec_filter <=365)  & (consumer_df['monetary'] < 100), 'segment'] = 'active low'""
    consumer_df.loc[(rec_filter <=365) & (first_purchase_filter <=365) & (consumer_df['monetary'] >= 100) , 'segment'] = 'new active high'
    consumer_df.loc[(rec_filter <=365) & (first_purchase_filter <=365) & (consumer_df['monetary'] < 100) , 'segment'] = 'new active low'
    consumer_df.loc[(rec_filter>365) & (rec_filter<=2*365) & (consumer_df['monetary'] >= 100), 'segment'] = 'warm high'
    consumer_df.loc[(rec_filter>365) & (rec_filter<=2*365) & (consumer_df['monetary'] < 100), 'segment'] = 'warm low'
    consumer_df.loc[(rec_filter>365) & (rec_filter<=2*365) & (first_purchase_filter <=2*365) & (consumer_df['monetary'] >= 100) , 'segment'] = 'new warm high'
    consumer_df.loc[(rec_filter>365) & (rec_filter<=2*365) & (first_purchase_filter <=2*365) & (consumer_df['monetary'] < 100) , 'segment'] = 'new warm low'
    consumer_df.loc[(rec_filter>2*365) & (rec_filter<=3*365), 'segment'] = 'cold'
    consumer_df.loc[(rec_filter>3*365), 'segment'] = 'inactive'
    return consumer_df
cons_df = get_consumer_df(df, offset=1*365);cons_df
get_segment_summary(cons_df)
| size | revenue_till_date | avg_revenue_till_date | recency_min | recency | recency_max | frequency_min | frequency | frequency_max | monetary_min | monetary | monetary_max | first_purchase | first_purchase_date | first_purchase_year | last_purchase_date | last_purchase_year | |
|---|---|---|---|---|---|---|---|---|---|---|---|---|---|---|---|---|---|
| segment | |||||||||||||||||
| new active high | 203 | 59506.22 | 293.134089 | 1 | 94.615764 | 336 | 1 | 1.049261 | 4 | 100.0 | 284.673498 | 4500.00 | 342 | 2014-01-24 | 2014 | 2014-12-31 | 2014 |
| new active low | 1234 | 45775.50 | 37.095219 | 1 | 138.251216 | 355 | 1 | 1.074554 | 10 | 5.0 | 34.364938 | 90.00 | 362 | 2014-01-04 | 2014 | 2014-12-31 | 2014 |
| active high | 475 | 665593.93 | 1401.250379 | 1 | 85.338947 | 342 | 2 | 5.696842 | 17 | 100.0 | 261.902155 | 4000.00 | 3645 | 2005-01-08 | 2005 | 2014-12-31 | 2014 |
| active low | 3011 | 699743.77 | 232.395805 | 1 | 98.091000 | 342 | 2 | 5.633677 | 40 | 5.0 | 40.459174 | 98.75 | 3647 | 2005-01-06 | 2005 | 2014-12-31 | 2014 |
| new warm high | 127 | 29418.34 | 231.640472 | 366 | 477.622047 | 721 | 1 | 1.047244 | 2 | 100.0 | 212.845669 | 2000.00 | 721 | 2013-01-10 | 2013 | 2013-12-31 | 2013 |
| new warm low | 1123 | 39498.00 | 35.171861 | 366 | 499.544969 | 722 | 1 | 1.058771 | 5 | 5.0 | 33.106115 | 99.00 | 722 | 2013-01-09 | 2013 | 2013-12-31 | 2013 |
| warm high | 111 | 92948.45 | 837.373423 | 366 | 461.198198 | 712 | 2 | 4.414414 | 14 | 100.0 | 187.849110 | 1250.00 | 3635 | 2005-01-18 | 2005 | 2013-12-31 | 2013 |
| warm low | 956 | 157955.50 | 165.225418 | 366 | 470.661088 | 720 | 2 | 4.361925 | 20 | 5.0 | 37.382060 | 98.00 | 3651 | 2005-01-02 | 2005 | 2013-12-31 | 2013 |
| cold | 2153 | 273645.09 | 127.099438 | 731 | 866.616814 | 1086 | 1 | 2.254064 | 23 | 5.0 | 51.114605 | 3043.75 | 3651 | 2005-01-02 | 2005 | 2012-12-31 | 2012 |
| inactive | 7512 | 651865.97 | 86.776620 | 1097 | 2058.441294 | 3649 | 1 | 1.730964 | 19 | 5.0 | 48.111199 | 3000.00 | 3651 | 2005-01-02 | 2005 | 2011-12-31 | 2011 |
cons_df['segment'].value_counts(dropna=False)
inactive           7512
active low         3011
cold               2153
new active low     1234
new warm low       1123
warm low            956
active high         475
new active high     203
new warm high       127
warm high           111
Name: segment, dtype: int64
cons_df['segment'].value_counts(dropna=False).sum() #+1512
16905
Revenue Generation#
How much revenue is generated in 2015?
df.head()
| consumer_id | purchase_amount | date_of_purchase | year_of_purchase | days_since | |
|---|---|---|---|---|---|
| 0 | 760 | 25.0 | 2009-11-06 | 2009 | 2247 |
| 1 | 860 | 50.0 | 2012-09-28 | 2012 | 1190 |
| 2 | 1200 | 100.0 | 2005-10-25 | 2005 | 3720 |
| 3 | 1420 | 50.0 | 2009-07-09 | 2009 | 2367 |
| 4 | 1940 | 70.0 | 2013-01-25 | 2013 | 1071 |
revenue_df = df[df['days_since'] <= 365].groupby('consumer_id').sum()
revenue_df.shape
(5398, 3)
revenue_df = df[df['year_of_purchase']==2015].groupby('consumer_id').agg(revenue=('purchase_amount', 'sum'))
revenue_df.shape
(5398, 1)
revenue_df.head()
| revenue | |
|---|---|
| consumer_id | |
| 80 | 80.0 |
| 480 | 45.0 |
| 830 | 50.0 |
| 850 | 60.0 |
| 860 | 60.0 |
cons_df= get_consumer_df(df, offset=0); cons_df.shape
(18417, 10)
get_segment_summary(pd.merge(cons_df, revenue_df, left_index=True,right_index=True, how='left').fillna(0))
| size | revenue_today | avg_revenue_today | revenue_till_date | avg_revenue_till_date | recency_min | recency | recency_max | frequency_min | frequency | frequency_max | monetary_min | monetary | monetary_max | first_purchase | first_purchase_date | first_purchase_year | last_purchase_date | last_purchase_year | |
|---|---|---|---|---|---|---|---|---|---|---|---|---|---|---|---|---|---|---|---|
| segment | |||||||||||||||||||
| new active high | 263 | 75629.21 | 287.563536 | 75629.21 | 287.563536 | 1 | 82.372624 | 360 | 1 | 1.015209 | 2 | 100.0 | 283.381027 | 4500.000000 | 360 | 2015-01-06 | 2015 | 2015-12-31 | 2015 |
| new active low | 1249 | 44070.00 | 35.284227 | 44070.00 | 35.284227 | 1 | 85.542034 | 359 | 1 | 1.052042 | 11 | 5.0 | 33.704697 | 90.000000 | 359 | 2015-01-07 | 2015 | 2015-12-31 | 2015 |
| active high | 573 | 185405.00 | 323.568935 | 788194.95 | 1375.558377 | 1 | 88.820244 | 344 | 2 | 5.888307 | 19 | 100.0 | 240.045740 | 4500.000000 | 4010 | 2005-01-08 | 2005 | 2015-12-31 | 2015 |
| active low | 3313 | 173289.92 | 52.306043 | 810481.97 | 244.636876 | 1 | 108.361002 | 359 | 2 | 5.935406 | 45 | 5.0 | 40.724525 | 99.000000 | 4012 | 2005-01-06 | 2005 | 2015-12-31 | 2015 |
| new warm high | 116 | 0.00 | 0.000000 | 36166.22 | 311.777759 | 366 | 476.060345 | 701 | 1 | 1.060345 | 4 | 100.0 | 302.036379 | 4000.000000 | 707 | 2014-01-24 | 2014 | 2014-12-31 | 2014 |
| new warm low | 822 | 0.00 | 0.000000 | 28854.50 | 35.102798 | 366 | 513.996350 | 720 | 1 | 1.042579 | 3 | 5.0 | 33.374290 | 90.000000 | 720 | 2014-01-11 | 2014 | 2014-12-31 | 2014 |
| warm high | 119 | 0.00 | 0.000000 | 168498.98 | 1415.957815 | 366 | 455.126050 | 665 | 2 | 4.714286 | 14 | 100.0 | 327.407457 | 4000.000000 | 4004 | 2005-01-14 | 2005 | 2014-12-31 | 2014 |
| warm low | 901 | 0.00 | 0.000000 | 159740.22 | 177.292142 | 366 | 474.377358 | 707 | 2 | 4.531632 | 20 | 5.0 | 38.591926 | 96.428571 | 4011 | 2005-01-07 | 2005 | 2014-12-31 | 2014 |
| cold | 1903 | 0.00 | 0.000000 | 232402.29 | 122.124167 | 731 | 857.781398 | 1087 | 1 | 2.303205 | 20 | 5.0 | 51.739893 | 2000.000000 | 4016 | 2005-01-02 | 2005 | 2013-12-31 | 2013 |
| inactive | 9158 | 0.00 | 0.000000 | 850306.56 | 92.848500 | 1096 | 2178.110832 | 4014 | 1 | 1.814479 | 23 | 5.0 | 48.112771 | 3043.750000 | 4016 | 2005-01-02 | 2005 | 2012-12-31 | 2012 |
cons_df_2014 = get_consumer_df(df, offset=365); cons_df_2014.shape
(16905, 10)
get_segment_summary(pd.merge(cons_df_2014, revenue_df, left_index=True,right_index=True, how='left').fillna(0))
| size | revenue_today | avg_revenue_today | revenue_till_date | avg_revenue_till_date | recency_min | recency | recency_max | frequency_min | frequency | frequency_max | monetary_min | monetary | monetary_max | first_purchase | first_purchase_date | first_purchase_year | last_purchase_date | last_purchase_year | |
|---|---|---|---|---|---|---|---|---|---|---|---|---|---|---|---|---|---|---|---|
| segment | |||||||||||||||||||
| new active high | 203 | 22275.00 | 109.729064 | 59506.22 | 293.134089 | 1 | 94.615764 | 336 | 1 | 1.049261 | 4 | 100.0 | 284.673498 | 4500.00 | 342 | 2014-01-24 | 2014 | 2014-12-31 | 2014 |
| new active low | 1234 | 22339.00 | 18.102917 | 45775.50 | 37.095219 | 1 | 138.251216 | 355 | 1 | 1.074554 | 10 | 5.0 | 34.364938 | 90.00 | 362 | 2014-01-04 | 2014 | 2014-12-31 | 2014 |
| active high | 475 | 120687.00 | 254.077895 | 665593.93 | 1401.250379 | 1 | 85.338947 | 342 | 2 | 5.696842 | 17 | 100.0 | 261.902155 | 4000.00 | 3645 | 2005-01-08 | 2005 | 2014-12-31 | 2014 |
| active low | 3011 | 126150.53 | 41.896556 | 699743.77 | 232.395805 | 1 | 98.091000 | 342 | 2 | 5.633677 | 40 | 5.0 | 40.459174 | 98.75 | 3647 | 2005-01-06 | 2005 | 2014-12-31 | 2014 |
| new warm high | 127 | 1925.00 | 15.157480 | 29418.34 | 231.640472 | 366 | 477.622047 | 721 | 1 | 1.047244 | 2 | 100.0 | 212.845669 | 2000.00 | 721 | 2013-01-10 | 2013 | 2013-12-31 | 2013 |
| new warm low | 1123 | 4405.00 | 3.922529 | 39498.00 | 35.171861 | 366 | 499.544969 | 722 | 1 | 1.058771 | 5 | 5.0 | 33.106115 | 99.00 | 722 | 2013-01-09 | 2013 | 2013-12-31 | 2013 |
| warm high | 111 | 12705.00 | 114.459459 | 92948.45 | 837.373423 | 366 | 461.198198 | 712 | 2 | 4.414414 | 14 | 100.0 | 187.849110 | 1250.00 | 3635 | 2005-01-18 | 2005 | 2013-12-31 | 2013 |
| warm low | 956 | 12901.00 | 13.494770 | 157955.50 | 165.225418 | 366 | 470.661088 | 720 | 2 | 4.361925 | 20 | 5.0 | 37.382060 | 98.00 | 3651 | 2005-01-02 | 2005 | 2013-12-31 | 2013 |
| cold | 2153 | 13151.00 | 6.108221 | 273645.09 | 127.099438 | 731 | 866.616814 | 1086 | 1 | 2.254064 | 23 | 5.0 | 51.114605 | 3043.75 | 3651 | 2005-01-02 | 2005 | 2012-12-31 | 2012 |
| inactive | 7512 | 22156.39 | 2.949466 | 651865.97 | 86.776620 | 1097 | 2058.441294 | 3649 | 1 | 1.730964 | 19 | 5.0 | 48.111199 | 3000.00 | 3651 | 2005-01-02 | 2005 | 2011-12-31 | 2011 |
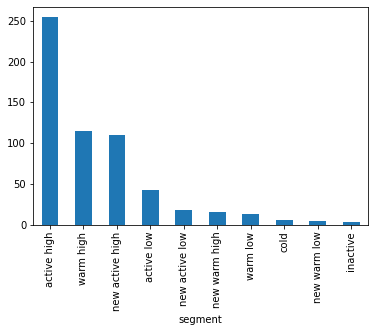
get_segment_summary(pd.merge(cons_df_2014, revenue_df, left_index=True,right_index=True, how='left').fillna(0))['avg_revenue_today'].sort_values(ascending=False).plot(kind='bar')
<AxesSubplot:xlabel='segment'>
df[df['purchase_amount']>0]
| consumer_id | purchase_amount | date_of_purchase | year_of_purchase | days_since | |
|---|---|---|---|---|---|
| 0 | 760 | 25.0 | 2009-11-06 | 2009 | 2247 |
| 1 | 860 | 50.0 | 2012-09-28 | 2012 | 1190 |
| 2 | 1200 | 100.0 | 2005-10-25 | 2005 | 3720 |
| 3 | 1420 | 50.0 | 2009-07-09 | 2009 | 2367 |
| 4 | 1940 | 70.0 | 2013-01-25 | 2013 | 1071 |
| ... | ... | ... | ... | ... | ... |
| 51238 | 163230 | 30.0 | 2011-11-12 | 2011 | 1511 |
| 51239 | 154410 | 100.0 | 2013-11-15 | 2013 | 777 |
| 51240 | 189270 | 30.0 | 2014-12-23 | 2014 | 374 |
| 51241 | 173810 | 30.0 | 2015-05-28 | 2015 | 218 |
| 51242 | 9830 | 50.0 | 2011-11-30 | 2011 | 1493 |
51243 rows × 5 columns