Preliminary EDA
Contents
Preliminary EDA#
Imports#
import pandas as pd
import seaborn as sns
import numpy as np
import scipy as sp
import matplotlib.pyplot as plt
sns.set()
Datasets#
df = pd.read_csv("segmentation data.csv", index_col="ID"); df
| Sex | Marital status | Age | Education | Income | Occupation | Settlement size | |
|---|---|---|---|---|---|---|---|
| ID | |||||||
| 100000001 | 0 | 0 | 67 | 2 | 124670 | 1 | 2 |
| 100000002 | 1 | 1 | 22 | 1 | 150773 | 1 | 2 |
| 100000003 | 0 | 0 | 49 | 1 | 89210 | 0 | 0 |
| 100000004 | 0 | 0 | 45 | 1 | 171565 | 1 | 1 |
| 100000005 | 0 | 0 | 53 | 1 | 149031 | 1 | 1 |
| ... | ... | ... | ... | ... | ... | ... | ... |
| 100001996 | 1 | 0 | 47 | 1 | 123525 | 0 | 0 |
| 100001997 | 1 | 1 | 27 | 1 | 117744 | 1 | 0 |
| 100001998 | 0 | 0 | 31 | 0 | 86400 | 0 | 0 |
| 100001999 | 1 | 1 | 24 | 1 | 97968 | 0 | 0 |
| 100002000 | 0 | 0 | 25 | 0 | 68416 | 0 | 0 |
2000 rows × 7 columns
df.describe()
| Sex | Marital status | Age | Education | Income | Occupation | Settlement size | |
|---|---|---|---|---|---|---|---|
| count | 2000.000000 | 2000.000000 | 2000.000000 | 2000.00000 | 2000.000000 | 2000.000000 | 2000.000000 |
| mean | 0.457000 | 0.496500 | 35.909000 | 1.03800 | 120954.419000 | 0.810500 | 0.739000 |
| std | 0.498272 | 0.500113 | 11.719402 | 0.59978 | 38108.824679 | 0.638587 | 0.812533 |
| min | 0.000000 | 0.000000 | 18.000000 | 0.00000 | 35832.000000 | 0.000000 | 0.000000 |
| 25% | 0.000000 | 0.000000 | 27.000000 | 1.00000 | 97663.250000 | 0.000000 | 0.000000 |
| 50% | 0.000000 | 0.000000 | 33.000000 | 1.00000 | 115548.500000 | 1.000000 | 1.000000 |
| 75% | 1.000000 | 1.000000 | 42.000000 | 1.00000 | 138072.250000 | 1.000000 | 1.000000 |
| max | 1.000000 | 1.000000 | 76.000000 | 3.00000 | 309364.000000 | 2.000000 | 2.000000 |
Correlation#
df.corr()
| Sex | Marital status | Age | Education | Income | Occupation | Settlement size | |
|---|---|---|---|---|---|---|---|
| Sex | 1.000000 | 0.566511 | -0.182885 | 0.244838 | -0.195146 | -0.202491 | -0.300803 |
| Marital status | 0.566511 | 1.000000 | -0.213178 | 0.374017 | -0.073528 | -0.029490 | -0.097041 |
| Age | -0.182885 | -0.213178 | 1.000000 | 0.654605 | 0.340610 | 0.108388 | 0.119751 |
| Education | 0.244838 | 0.374017 | 0.654605 | 1.000000 | 0.233459 | 0.064524 | 0.034732 |
| Income | -0.195146 | -0.073528 | 0.340610 | 0.233459 | 1.000000 | 0.680357 | 0.490881 |
| Occupation | -0.202491 | -0.029490 | 0.108388 | 0.064524 | 0.680357 | 1.000000 | 0.571795 |
| Settlement size | -0.300803 | -0.097041 | 0.119751 | 0.034732 | 0.490881 | 0.571795 | 1.000000 |
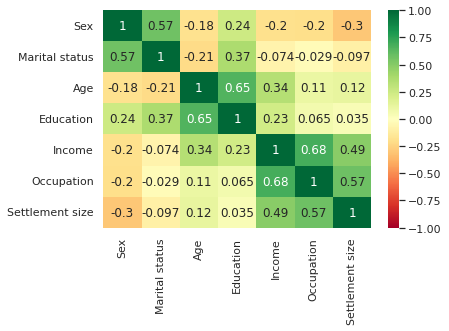
sns.heatmap(df.corr(), cmap='RdYlGn', vmin=-1, vmax=1, annot=True)
<AxesSubplot:>
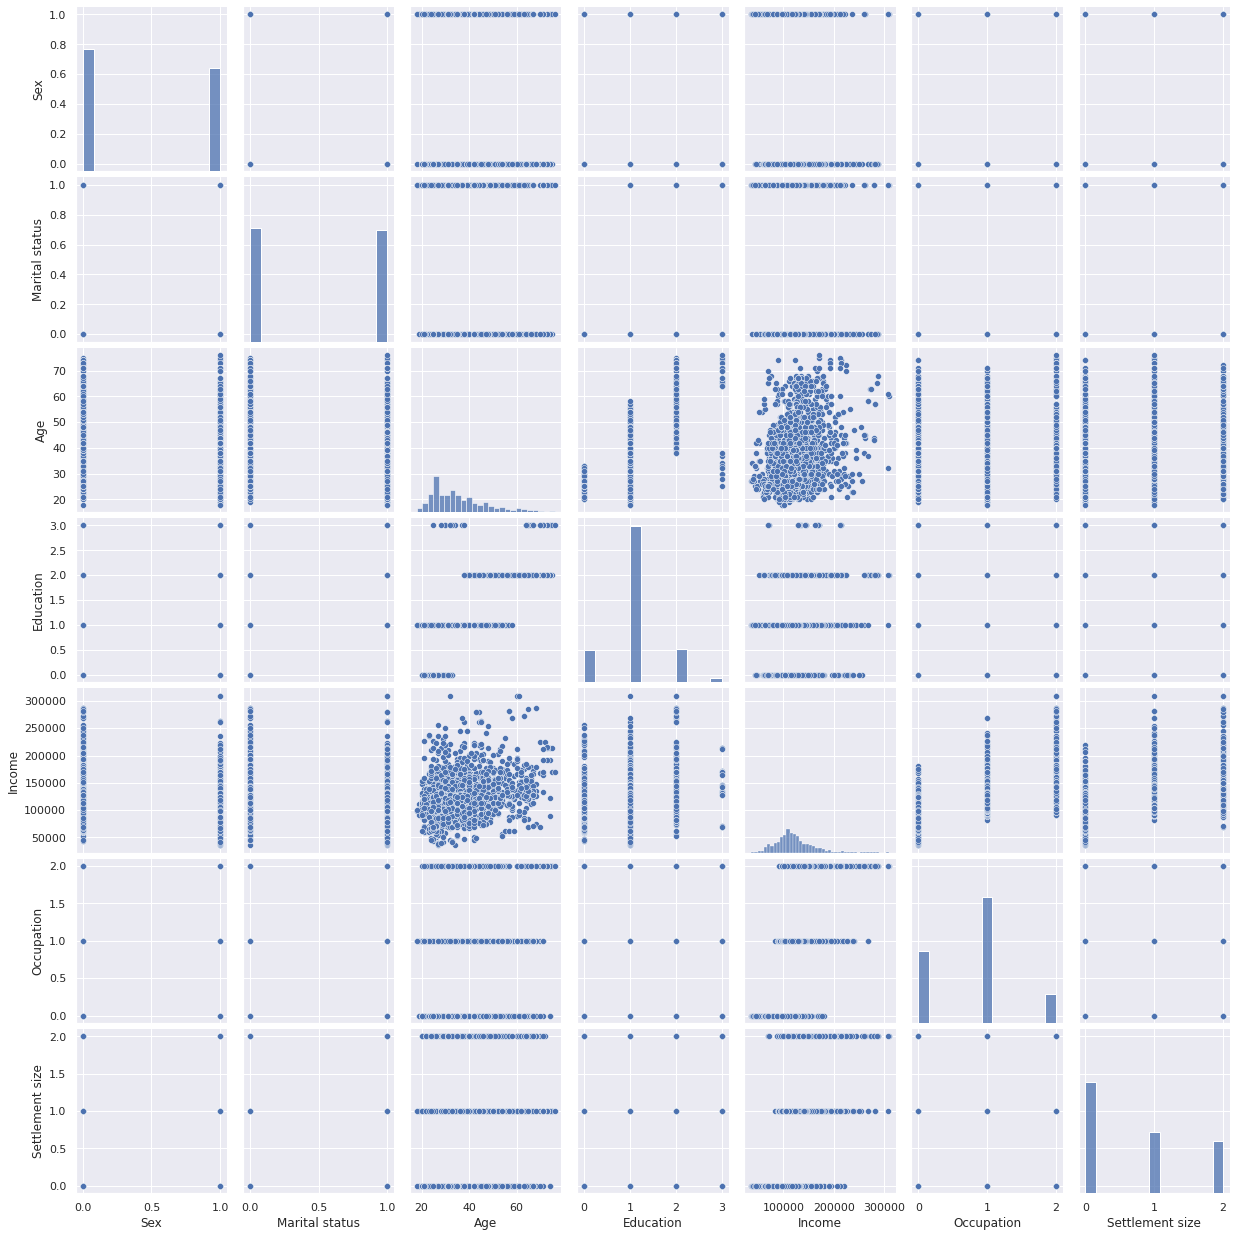
sns.pairplot(df)
<seaborn.axisgrid.PairGrid at 0xe578cab9190>
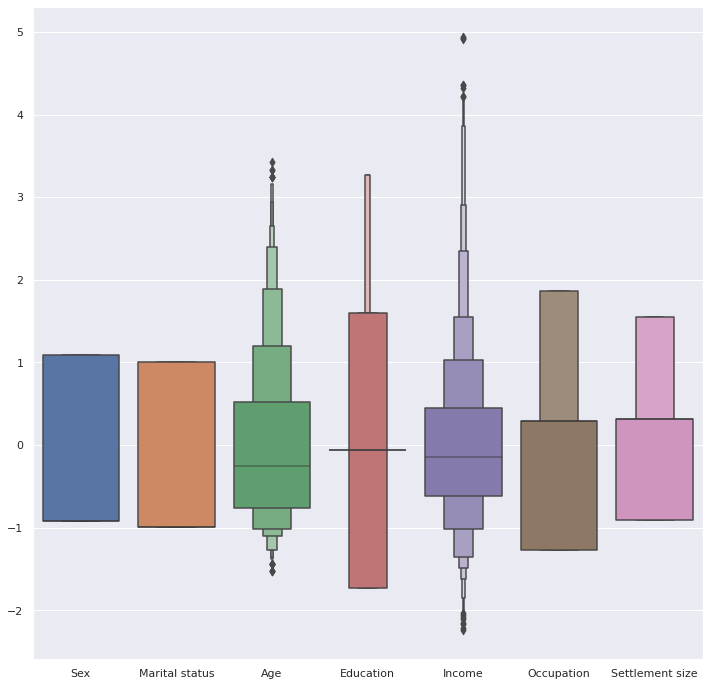
fig, ax = plt.subplots(figsize=(12,12))
sns.boxenplot(data=(df-df.mean())/df.std(),ax=ax)
<AxesSubplot:>