Automobiles
Contents
Automobiles#
%load_ext autoreload
%autoreload 2
%matplotlib inline
The autoreload extension is already loaded. To reload it, use:
  %reload_ext autoreload
Imports#
from fastai.vision.all import *
from aiking.data.external import * #We need to import this after fastai modules
import pandas as pd
from sklearn.ensemble import RandomForestRegressor, ExtraTreesRegressor
from sklearn.model_selection import cross_val_score
from sklearn.model_selection import train_test_split
from sklearn.metrics import r2_score, make_scorer
from sklearn.feature_selection import mutual_info_regression
from sklearn.preprocessing import StandardScaler
from sklearn.decomposition import PCA
from sklearn.pipeline import make_pipeline
import seaborn as sns
import matplotlib.pyplot as plt
import ipywidgets as widgets
from ipywidgets import interact, interactive, fixed, interact_manual
plt.style.use('ggplot')
Getting Dataset#
# kaggle datasets download -d toramky/automobile-dataset
path = untar_data("kaggle_datasets::toramky/automobile-dataset"); path
Path('/content/drive/MyDrive/PPV/S_Personal_Study/aiking/data/automobile-dataset')
path.ls()
(#1) [Path('/content/drive/MyDrive/PPV/S_Personal_Study/aiking/data/automobile-dataset/Automobile_data.csv')]
df = pd.read_csv(path/'Automobile_data.csv', na_values=["?"]); df.head()
| symboling | normalized-losses | make | fuel-type | aspiration | num-of-doors | body-style | drive-wheels | engine-location | wheel-base | length | width | height | curb-weight | engine-type | num-of-cylinders | engine-size | fuel-system | bore | stroke | compression-ratio | horsepower | peak-rpm | city-mpg | highway-mpg | price | |
|---|---|---|---|---|---|---|---|---|---|---|---|---|---|---|---|---|---|---|---|---|---|---|---|---|---|---|
| 0 | 3 | NaN | alfa-romero | gas | std | two | convertible | rwd | front | 88.6 | 168.8 | 64.1 | 48.8 | 2548 | dohc | four | 130 | mpfi | 3.47 | 2.68 | 9.0 | 111.0 | 5000.0 | 21 | 27 | 13495.0 |
| 1 | 3 | NaN | alfa-romero | gas | std | two | convertible | rwd | front | 88.6 | 168.8 | 64.1 | 48.8 | 2548 | dohc | four | 130 | mpfi | 3.47 | 2.68 | 9.0 | 111.0 | 5000.0 | 21 | 27 | 16500.0 |
| 2 | 1 | NaN | alfa-romero | gas | std | two | hatchback | rwd | front | 94.5 | 171.2 | 65.5 | 52.4 | 2823 | ohcv | six | 152 | mpfi | 2.68 | 3.47 | 9.0 | 154.0 | 5000.0 | 19 | 26 | 16500.0 |
| 3 | 2 | 164.0 | audi | gas | std | four | sedan | fwd | front | 99.8 | 176.6 | 66.2 | 54.3 | 2337 | ohc | four | 109 | mpfi | 3.19 | 3.40 | 10.0 | 102.0 | 5500.0 | 24 | 30 | 13950.0 |
| 4 | 2 | 164.0 | audi | gas | std | four | sedan | 4wd | front | 99.4 | 176.6 | 66.4 | 54.3 | 2824 | ohc | five | 136 | mpfi | 3.19 | 3.40 | 8.0 | 115.0 | 5500.0 | 18 | 22 | 17450.0 |
X = df.fillna(0).copy()
y = X.pop("price")
X
| symboling | normalized-losses | make | fuel-type | aspiration | num-of-doors | body-style | drive-wheels | engine-location | wheel-base | length | width | height | curb-weight | engine-type | num-of-cylinders | engine-size | fuel-system | bore | stroke | compression-ratio | horsepower | peak-rpm | city-mpg | highway-mpg | |
|---|---|---|---|---|---|---|---|---|---|---|---|---|---|---|---|---|---|---|---|---|---|---|---|---|---|
| 0 | 3 | 0.0 | alfa-romero | gas | std | two | convertible | rwd | front | 88.6 | 168.8 | 64.1 | 48.8 | 2548 | dohc | four | 130 | mpfi | 3.47 | 2.68 | 9.0 | 111.0 | 5000.0 | 21 | 27 |
| 1 | 3 | 0.0 | alfa-romero | gas | std | two | convertible | rwd | front | 88.6 | 168.8 | 64.1 | 48.8 | 2548 | dohc | four | 130 | mpfi | 3.47 | 2.68 | 9.0 | 111.0 | 5000.0 | 21 | 27 |
| 2 | 1 | 0.0 | alfa-romero | gas | std | two | hatchback | rwd | front | 94.5 | 171.2 | 65.5 | 52.4 | 2823 | ohcv | six | 152 | mpfi | 2.68 | 3.47 | 9.0 | 154.0 | 5000.0 | 19 | 26 |
| 3 | 2 | 164.0 | audi | gas | std | four | sedan | fwd | front | 99.8 | 176.6 | 66.2 | 54.3 | 2337 | ohc | four | 109 | mpfi | 3.19 | 3.40 | 10.0 | 102.0 | 5500.0 | 24 | 30 |
| 4 | 2 | 164.0 | audi | gas | std | four | sedan | 4wd | front | 99.4 | 176.6 | 66.4 | 54.3 | 2824 | ohc | five | 136 | mpfi | 3.19 | 3.40 | 8.0 | 115.0 | 5500.0 | 18 | 22 |
| ... | ... | ... | ... | ... | ... | ... | ... | ... | ... | ... | ... | ... | ... | ... | ... | ... | ... | ... | ... | ... | ... | ... | ... | ... | ... |
| 200 | -1 | 95.0 | volvo | gas | std | four | sedan | rwd | front | 109.1 | 188.8 | 68.9 | 55.5 | 2952 | ohc | four | 141 | mpfi | 3.78 | 3.15 | 9.5 | 114.0 | 5400.0 | 23 | 28 |
| 201 | -1 | 95.0 | volvo | gas | turbo | four | sedan | rwd | front | 109.1 | 188.8 | 68.8 | 55.5 | 3049 | ohc | four | 141 | mpfi | 3.78 | 3.15 | 8.7 | 160.0 | 5300.0 | 19 | 25 |
| 202 | -1 | 95.0 | volvo | gas | std | four | sedan | rwd | front | 109.1 | 188.8 | 68.9 | 55.5 | 3012 | ohcv | six | 173 | mpfi | 3.58 | 2.87 | 8.8 | 134.0 | 5500.0 | 18 | 23 |
| 203 | -1 | 95.0 | volvo | diesel | turbo | four | sedan | rwd | front | 109.1 | 188.8 | 68.9 | 55.5 | 3217 | ohc | six | 145 | idi | 3.01 | 3.40 | 23.0 | 106.0 | 4800.0 | 26 | 27 |
| 204 | -1 | 95.0 | volvo | gas | turbo | four | sedan | rwd | front | 109.1 | 188.8 | 68.9 | 55.5 | 3062 | ohc | four | 141 | mpfi | 3.78 | 3.15 | 9.5 | 114.0 | 5400.0 | 19 | 25 |
205 rows × 25 columns
Mutual Information (MI)#
for colname in X.select_dtypes("object"):
    X[colname], _ = X[colname].factorize()
X
| symboling | normalized-losses | make | fuel-type | aspiration | num-of-doors | body-style | drive-wheels | engine-location | wheel-base | length | width | height | curb-weight | engine-type | num-of-cylinders | engine-size | fuel-system | bore | stroke | compression-ratio | horsepower | peak-rpm | city-mpg | highway-mpg | |
|---|---|---|---|---|---|---|---|---|---|---|---|---|---|---|---|---|---|---|---|---|---|---|---|---|---|
| 0 | 3 | 0.0 | 0 | 0 | 0 | 0 | 0 | 0 | 0 | 88.6 | 168.8 | 64.1 | 48.8 | 2548 | 0 | 0 | 130 | 0 | 3.47 | 2.68 | 9.0 | 111.0 | 5000.0 | 21 | 27 |
| 1 | 3 | 0.0 | 0 | 0 | 0 | 0 | 0 | 0 | 0 | 88.6 | 168.8 | 64.1 | 48.8 | 2548 | 0 | 0 | 130 | 0 | 3.47 | 2.68 | 9.0 | 111.0 | 5000.0 | 21 | 27 |
| 2 | 1 | 0.0 | 0 | 0 | 0 | 0 | 1 | 0 | 0 | 94.5 | 171.2 | 65.5 | 52.4 | 2823 | 1 | 1 | 152 | 0 | 2.68 | 3.47 | 9.0 | 154.0 | 5000.0 | 19 | 26 |
| 3 | 2 | 164.0 | 1 | 0 | 0 | 1 | 2 | 1 | 0 | 99.8 | 176.6 | 66.2 | 54.3 | 2337 | 2 | 0 | 109 | 0 | 3.19 | 3.40 | 10.0 | 102.0 | 5500.0 | 24 | 30 |
| 4 | 2 | 164.0 | 1 | 0 | 0 | 1 | 2 | 2 | 0 | 99.4 | 176.6 | 66.4 | 54.3 | 2824 | 2 | 2 | 136 | 0 | 3.19 | 3.40 | 8.0 | 115.0 | 5500.0 | 18 | 22 |
| ... | ... | ... | ... | ... | ... | ... | ... | ... | ... | ... | ... | ... | ... | ... | ... | ... | ... | ... | ... | ... | ... | ... | ... | ... | ... |
| 200 | -1 | 95.0 | 21 | 0 | 0 | 1 | 2 | 0 | 0 | 109.1 | 188.8 | 68.9 | 55.5 | 2952 | 2 | 0 | 141 | 0 | 3.78 | 3.15 | 9.5 | 114.0 | 5400.0 | 23 | 28 |
| 201 | -1 | 95.0 | 21 | 0 | 1 | 1 | 2 | 0 | 0 | 109.1 | 188.8 | 68.8 | 55.5 | 3049 | 2 | 0 | 141 | 0 | 3.78 | 3.15 | 8.7 | 160.0 | 5300.0 | 19 | 25 |
| 202 | -1 | 95.0 | 21 | 0 | 0 | 1 | 2 | 0 | 0 | 109.1 | 188.8 | 68.9 | 55.5 | 3012 | 1 | 1 | 173 | 0 | 3.58 | 2.87 | 8.8 | 134.0 | 5500.0 | 18 | 23 |
| 203 | -1 | 95.0 | 21 | 1 | 1 | 1 | 2 | 0 | 0 | 109.1 | 188.8 | 68.9 | 55.5 | 3217 | 2 | 1 | 145 | 6 | 3.01 | 3.40 | 23.0 | 106.0 | 4800.0 | 26 | 27 |
| 204 | -1 | 95.0 | 21 | 0 | 1 | 1 | 2 | 0 | 0 | 109.1 | 188.8 | 68.9 | 55.5 | 3062 | 2 | 0 | 141 | 0 | 3.78 | 3.15 | 9.5 | 114.0 | 5400.0 | 19 | 25 |
205 rows × 25 columns
X.dtypes
symboling              int64
normalized-losses    float64
make                   int64
fuel-type              int64
aspiration             int64
num-of-doors           int64
body-style             int64
drive-wheels           int64
engine-location        int64
wheel-base           float64
length               float64
width                float64
height               float64
curb-weight            int64
engine-type            int64
num-of-cylinders       int64
engine-size            int64
fuel-system            int64
bore                 float64
stroke               float64
compression-ratio    float64
horsepower           float64
peak-rpm             float64
city-mpg               int64
highway-mpg            int64
dtype: object
X.dtypes == int
symboling             True
normalized-losses    False
make                  True
fuel-type             True
aspiration            True
num-of-doors          True
body-style            True
drive-wheels          True
engine-location       True
wheel-base           False
length               False
width                False
height               False
curb-weight           True
engine-type           True
num-of-cylinders      True
engine-size           True
fuel-system           True
bore                 False
stroke               False
compression-ratio    False
horsepower           False
peak-rpm             False
city-mpg              True
highway-mpg           True
dtype: bool
discrete_features = X.dtypes == int; discrete_features
symboling             True
normalized-losses    False
make                  True
fuel-type             True
aspiration            True
num-of-doors          True
body-style            True
drive-wheels          True
engine-location       True
wheel-base           False
length               False
width                False
height               False
curb-weight           True
engine-type           True
num-of-cylinders      True
engine-size           True
fuel-system           True
bore                 False
stroke               False
compression-ratio    False
horsepower           False
peak-rpm             False
city-mpg              True
highway-mpg           True
dtype: bool
y[y=="?"]
Series([], Name: price, dtype: float64)
X
| symboling | normalized-losses | make | fuel-type | aspiration | num-of-doors | body-style | drive-wheels | engine-location | wheel-base | length | width | height | curb-weight | engine-type | num-of-cylinders | engine-size | fuel-system | bore | stroke | compression-ratio | horsepower | peak-rpm | city-mpg | highway-mpg | |
|---|---|---|---|---|---|---|---|---|---|---|---|---|---|---|---|---|---|---|---|---|---|---|---|---|---|
| 0 | 3 | 0.0 | 0 | 0 | 0 | 0 | 0 | 0 | 0 | 88.6 | 168.8 | 64.1 | 48.8 | 2548 | 0 | 0 | 130 | 0 | 3.47 | 2.68 | 9.0 | 111.0 | 5000.0 | 21 | 27 |
| 1 | 3 | 0.0 | 0 | 0 | 0 | 0 | 0 | 0 | 0 | 88.6 | 168.8 | 64.1 | 48.8 | 2548 | 0 | 0 | 130 | 0 | 3.47 | 2.68 | 9.0 | 111.0 | 5000.0 | 21 | 27 |
| 2 | 1 | 0.0 | 0 | 0 | 0 | 0 | 1 | 0 | 0 | 94.5 | 171.2 | 65.5 | 52.4 | 2823 | 1 | 1 | 152 | 0 | 2.68 | 3.47 | 9.0 | 154.0 | 5000.0 | 19 | 26 |
| 3 | 2 | 164.0 | 1 | 0 | 0 | 1 | 2 | 1 | 0 | 99.8 | 176.6 | 66.2 | 54.3 | 2337 | 2 | 0 | 109 | 0 | 3.19 | 3.40 | 10.0 | 102.0 | 5500.0 | 24 | 30 |
| 4 | 2 | 164.0 | 1 | 0 | 0 | 1 | 2 | 2 | 0 | 99.4 | 176.6 | 66.4 | 54.3 | 2824 | 2 | 2 | 136 | 0 | 3.19 | 3.40 | 8.0 | 115.0 | 5500.0 | 18 | 22 |
| ... | ... | ... | ... | ... | ... | ... | ... | ... | ... | ... | ... | ... | ... | ... | ... | ... | ... | ... | ... | ... | ... | ... | ... | ... | ... |
| 200 | -1 | 95.0 | 21 | 0 | 0 | 1 | 2 | 0 | 0 | 109.1 | 188.8 | 68.9 | 55.5 | 2952 | 2 | 0 | 141 | 0 | 3.78 | 3.15 | 9.5 | 114.0 | 5400.0 | 23 | 28 |
| 201 | -1 | 95.0 | 21 | 0 | 1 | 1 | 2 | 0 | 0 | 109.1 | 188.8 | 68.8 | 55.5 | 3049 | 2 | 0 | 141 | 0 | 3.78 | 3.15 | 8.7 | 160.0 | 5300.0 | 19 | 25 |
| 202 | -1 | 95.0 | 21 | 0 | 0 | 1 | 2 | 0 | 0 | 109.1 | 188.8 | 68.9 | 55.5 | 3012 | 1 | 1 | 173 | 0 | 3.58 | 2.87 | 8.8 | 134.0 | 5500.0 | 18 | 23 |
| 203 | -1 | 95.0 | 21 | 1 | 1 | 1 | 2 | 0 | 0 | 109.1 | 188.8 | 68.9 | 55.5 | 3217 | 2 | 1 | 145 | 6 | 3.01 | 3.40 | 23.0 | 106.0 | 4800.0 | 26 | 27 |
| 204 | -1 | 95.0 | 21 | 0 | 1 | 1 | 2 | 0 | 0 | 109.1 | 188.8 | 68.9 | 55.5 | 3062 | 2 | 0 | 141 | 0 | 3.78 | 3.15 | 9.5 | 114.0 | 5400.0 | 19 | 25 |
205 rows × 25 columns
mi_scores = mutual_info_regression(X, y, discrete_features=discrete_features)
mi_scores = pd.Series(mi_scores, name="MI Scores", index=X.columns).sort_values(ascending=False)
mi_scores
curb-weight          1.389106
engine-size          1.008542
highway-mpg          0.933126
horsepower           0.838589
city-mpg             0.824853
width                0.654700
length               0.560122
wheel-base           0.557972
make                 0.556152
bore                 0.471904
fuel-system          0.447296
height               0.352667
stroke               0.323039
drive-wheels         0.314699
num-of-cylinders     0.313724
normalized-losses    0.288269
peak-rpm             0.226938
symboling            0.213840
compression-ratio    0.186054
engine-type          0.156490
aspiration           0.080632
body-style           0.057173
fuel-type            0.039664
engine-location      0.034692
num-of-doors         0.006551
Name: MI Scores, dtype: float64
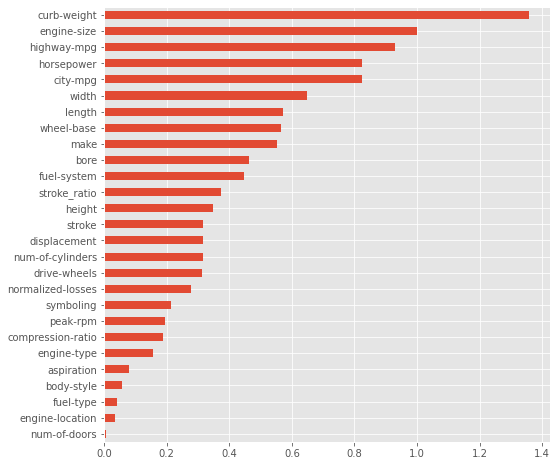
mi_scores.sort_values(ascending=True).plot(kind='barh', figsize=(8,8))
<matplotlib.axes._subplots.AxesSubplot at 0x7f37ed82f9d0>

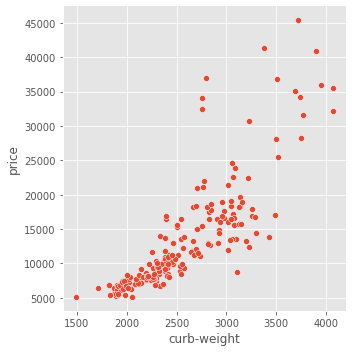
sns.relplot(x='curb-weight', y='price', data=df)
<seaborn.axisgrid.FacetGrid at 0x7f37ed700050>
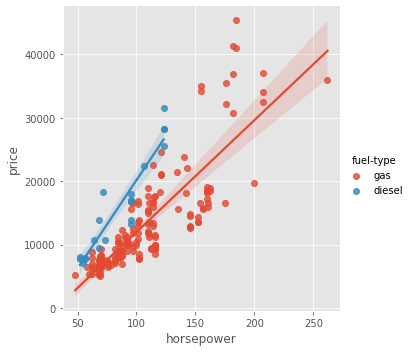
MI doesnot take into account interaction effect
‘fuel-type’ is low on MI but adding it improves the price explaination (Don’t reject just based on MI)
sns.lmplot(x="horsepower", y="price", hue="fuel-type", data=df);
df.select_dtypes(['float','int'])
| symboling | normalized-losses | wheel-base | length | width | height | curb-weight | engine-size | bore | stroke | compression-ratio | horsepower | peak-rpm | city-mpg | highway-mpg | price | |
|---|---|---|---|---|---|---|---|---|---|---|---|---|---|---|---|---|
| 0 | 3 | NaN | 88.6 | 168.8 | 64.1 | 48.8 | 2548 | 130 | 3.47 | 2.68 | 9.0 | 111.0 | 5000.0 | 21 | 27 | 13495.0 |
| 1 | 3 | NaN | 88.6 | 168.8 | 64.1 | 48.8 | 2548 | 130 | 3.47 | 2.68 | 9.0 | 111.0 | 5000.0 | 21 | 27 | 16500.0 |
| 2 | 1 | NaN | 94.5 | 171.2 | 65.5 | 52.4 | 2823 | 152 | 2.68 | 3.47 | 9.0 | 154.0 | 5000.0 | 19 | 26 | 16500.0 |
| 3 | 2 | 164.0 | 99.8 | 176.6 | 66.2 | 54.3 | 2337 | 109 | 3.19 | 3.40 | 10.0 | 102.0 | 5500.0 | 24 | 30 | 13950.0 |
| 4 | 2 | 164.0 | 99.4 | 176.6 | 66.4 | 54.3 | 2824 | 136 | 3.19 | 3.40 | 8.0 | 115.0 | 5500.0 | 18 | 22 | 17450.0 |
| ... | ... | ... | ... | ... | ... | ... | ... | ... | ... | ... | ... | ... | ... | ... | ... | ... |
| 200 | -1 | 95.0 | 109.1 | 188.8 | 68.9 | 55.5 | 2952 | 141 | 3.78 | 3.15 | 9.5 | 114.0 | 5400.0 | 23 | 28 | 16845.0 |
| 201 | -1 | 95.0 | 109.1 | 188.8 | 68.8 | 55.5 | 3049 | 141 | 3.78 | 3.15 | 8.7 | 160.0 | 5300.0 | 19 | 25 | 19045.0 |
| 202 | -1 | 95.0 | 109.1 | 188.8 | 68.9 | 55.5 | 3012 | 173 | 3.58 | 2.87 | 8.8 | 134.0 | 5500.0 | 18 | 23 | 21485.0 |
| 203 | -1 | 95.0 | 109.1 | 188.8 | 68.9 | 55.5 | 3217 | 145 | 3.01 | 3.40 | 23.0 | 106.0 | 4800.0 | 26 | 27 | 22470.0 |
| 204 | -1 | 95.0 | 109.1 | 188.8 | 68.9 | 55.5 | 3062 | 141 | 3.78 | 3.15 | 9.5 | 114.0 | 5400.0 | 19 | 25 | 22625.0 |
205 rows × 16 columns
df.shape
(205, 26)
num_cols = df.select_dtypes(['float', 'int']).columns
cat_cols = df.select_dtypes('object').columns
@interact(num_col=num_cols, cat_col=cat_cols)
def plot(num_col, cat_col):
    sns.relplot(x=num_col, y='price', data=df)
    sns.lmplot(x=num_col, y="price", hue=cat_col, data=df)
X_train, X_holdout, y_train, y_holdout = train_test_split(X, y, test_size=0.2, random_state=42)
Baseline Model#
model = RandomForestRegressor(); model
RandomForestRegressor()
scores = cross_val_score(model, X_train, y_train, cv=5, scoring='r2')
scores.mean()
0.7978904308207849
scores
array([0.85095168, 0.95340487, 0.7862429 , 0.91746912, 0.48138359])
This model is not yet fitted. It basically tracks the capacity / ( over-fitting of raw model on Data).cross_val_score copies the estimator before fitting the same on parts. The model then needs to be trained on complete dataset before predicting on the holdout data
model.fit(X_train, y_train)
RandomForestRegressor()
r2_score(y_holdout, model.predict(X_holdout))
0.8505374645526409
r2_score(y_train, model.predict(X_train))
0.96246216169697
Reduced Feature Model#
mi_scores[:15].index
Index(['curb-weight', 'engine-size', 'highway-mpg', 'horsepower', 'city-mpg',
       'width', 'length', 'wheel-base', 'make', 'bore', 'fuel-system',
       'height', 'stroke', 'drive-wheels', 'num-of-cylinders'],
      dtype='object')
model_reduced = RandomForestRegressor()
scores = cross_val_score(model_reduced, X_train[mi_scores[:15].index], y_train, cv=5, scoring='r2'); scores.mean()
0.7850512535366945
scores
array([0.85217899, 0.93233023, 0.76150246, 0.9104315 , 0.46881309])
model_reduced.fit(X_train[mi_scores[:15].index], y_train)
RandomForestRegressor()
r2_score(y_holdout, model_reduced.predict(X_holdout[mi_scores[:15].index])), r2_score(y_train, model_reduced.predict(X_train[mi_scores[:15].index]))
(0.8265900980656524, 0.9694392691698007)
def feature_model(X_train, y_train, X_holdout, y_holdout, mi_scores, estimator=RandomForestRegressor(), n_cols=10):
    sel_cols = mi_scores[:n_cols].index
    scores = cross_val_score(estimator, X_train[sel_cols], y_train, cv=5, scoring='r2')
    model.fit(X_train[sel_cols], y_train)
    return {
        'k': n_cols,
        'cv_mean': scores.mean(),
        'holdout':r2_score(y_holdout, model.predict(X_holdout[sel_cols])),
        'train': r2_score(y_train, model.predict(X_train[sel_cols]))
    }
feature_model(X_train, y_train, X_holdout, y_holdout, mi_scores, n_cols=10)
{'cv_mean': 0.787900056041571,
 'holdout': 0.8268471781204396,
 'k': 10,
 'train': 0.9732744993383893}
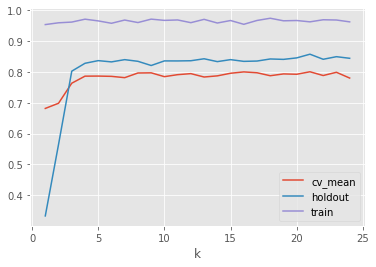
df_features = pd.DataFrame([feature_model(X_train, y_train, X_holdout, y_holdout, mi_scores, n_cols=k) for k in range(1,25)])
df_features.plot(x='k')
<matplotlib.axes._subplots.AxesSubplot at 0x7f37ed3a21d0>
df_features
| k | cv_mean | holdout | train | |
|---|---|---|---|---|
| 0 | 1 | 0.681796 | 0.332996 | 0.953905 |
| 1 | 2 | 0.698563 | 0.564750 | 0.959669 |
| 2 | 3 | 0.763651 | 0.802725 | 0.962008 |
| 3 | 4 | 0.786535 | 0.828275 | 0.971400 |
| 4 | 5 | 0.786793 | 0.836906 | 0.965836 |
| 5 | 6 | 0.785895 | 0.832797 | 0.958112 |
| 6 | 7 | 0.781646 | 0.840111 | 0.968623 |
| 7 | 8 | 0.796786 | 0.834703 | 0.960458 |
| 8 | 9 | 0.797306 | 0.821109 | 0.971560 |
| 9 | 10 | 0.784905 | 0.836016 | 0.967543 |
| 10 | 11 | 0.791368 | 0.835919 | 0.968914 |
| 11 | 12 | 0.794696 | 0.836563 | 0.960086 |
| 12 | 13 | 0.783753 | 0.842935 | 0.970898 |
| 13 | 14 | 0.787471 | 0.833692 | 0.958966 |
| 14 | 15 | 0.795940 | 0.840154 | 0.967076 |
| 15 | 16 | 0.800306 | 0.834524 | 0.954770 |
| 16 | 17 | 0.797541 | 0.835549 | 0.967275 |
| 17 | 18 | 0.787937 | 0.842294 | 0.974459 |
| 18 | 19 | 0.793785 | 0.840984 | 0.966164 |
| 19 | 20 | 0.792703 | 0.845809 | 0.967088 |
| 20 | 21 | 0.800757 | 0.857779 | 0.962757 |
| 21 | 22 | 0.788593 | 0.841297 | 0.969550 |
| 22 | 23 | 0.799097 | 0.849720 | 0.968724 |
| 23 | 24 | 0.780353 | 0.844495 | 0.962705 |
Creating Custom Features#
def feature_extractors(X, callbacks=None):
    features = X
    if callbacks:
        features = pd.concat([callback(X) for callback in callbacks] + [X], axis=1)
    return features
def create_custom_features(X):
    features = pd.DataFrame()
    features['stroke_ratio'] = X['stroke']/X['bore']
    features['displacement'] = np.pi*((X['bore']*0.5)**2)*X['stroke']*X['num-of-cylinders']
    return features
feature_extractors(X, callbacks=[create_custom_features]).fillna(0)
| stroke_ratio | displacement | symboling | normalized-losses | make | fuel-type | aspiration | num-of-doors | body-style | drive-wheels | engine-location | wheel-base | length | width | height | curb-weight | engine-type | num-of-cylinders | engine-size | fuel-system | bore | stroke | compression-ratio | horsepower | peak-rpm | city-mpg | highway-mpg | |
|---|---|---|---|---|---|---|---|---|---|---|---|---|---|---|---|---|---|---|---|---|---|---|---|---|---|---|---|
| 0 | 0.772334 | 0.000000 | 3 | 0.0 | 0 | 0 | 0 | 0 | 0 | 0 | 0 | 88.6 | 168.8 | 64.1 | 48.8 | 2548 | 0 | 0 | 130 | 0 | 3.47 | 2.68 | 9.0 | 111.0 | 5000.0 | 21 | 27 |
| 1 | 0.772334 | 0.000000 | 3 | 0.0 | 0 | 0 | 0 | 0 | 0 | 0 | 0 | 88.6 | 168.8 | 64.1 | 48.8 | 2548 | 0 | 0 | 130 | 0 | 3.47 | 2.68 | 9.0 | 111.0 | 5000.0 | 21 | 27 |
| 2 | 1.294776 | 19.574422 | 1 | 0.0 | 0 | 0 | 0 | 0 | 1 | 0 | 0 | 94.5 | 171.2 | 65.5 | 52.4 | 2823 | 1 | 1 | 152 | 0 | 2.68 | 3.47 | 9.0 | 154.0 | 5000.0 | 19 | 26 |
| 3 | 1.065831 | 0.000000 | 2 | 164.0 | 1 | 0 | 0 | 1 | 2 | 1 | 0 | 99.8 | 176.6 | 66.2 | 54.3 | 2337 | 2 | 0 | 109 | 0 | 3.19 | 3.40 | 10.0 | 102.0 | 5500.0 | 24 | 30 |
| 4 | 1.065831 | 54.347574 | 2 | 164.0 | 1 | 0 | 0 | 1 | 2 | 2 | 0 | 99.4 | 176.6 | 66.4 | 54.3 | 2824 | 2 | 2 | 136 | 0 | 3.19 | 3.40 | 8.0 | 115.0 | 5500.0 | 18 | 22 |
| ... | ... | ... | ... | ... | ... | ... | ... | ... | ... | ... | ... | ... | ... | ... | ... | ... | ... | ... | ... | ... | ... | ... | ... | ... | ... | ... | ... |
| 200 | 0.833333 | 0.000000 | -1 | 95.0 | 21 | 0 | 0 | 1 | 2 | 0 | 0 | 109.1 | 188.8 | 68.9 | 55.5 | 2952 | 2 | 0 | 141 | 0 | 3.78 | 3.15 | 9.5 | 114.0 | 5400.0 | 23 | 28 |
| 201 | 0.833333 | 0.000000 | -1 | 95.0 | 21 | 0 | 1 | 1 | 2 | 0 | 0 | 109.1 | 188.8 | 68.8 | 55.5 | 3049 | 2 | 0 | 141 | 0 | 3.78 | 3.15 | 8.7 | 160.0 | 5300.0 | 19 | 25 |
| 202 | 0.801676 | 28.889354 | -1 | 95.0 | 21 | 0 | 0 | 1 | 2 | 0 | 0 | 109.1 | 188.8 | 68.9 | 55.5 | 3012 | 1 | 1 | 173 | 0 | 3.58 | 2.87 | 8.8 | 134.0 | 5500.0 | 18 | 23 |
| 203 | 1.129568 | 24.193672 | -1 | 95.0 | 21 | 1 | 1 | 1 | 2 | 0 | 0 | 109.1 | 188.8 | 68.9 | 55.5 | 3217 | 2 | 1 | 145 | 6 | 3.01 | 3.40 | 23.0 | 106.0 | 4800.0 | 26 | 27 |
| 204 | 0.833333 | 0.000000 | -1 | 95.0 | 21 | 0 | 1 | 1 | 2 | 0 | 0 | 109.1 | 188.8 | 68.9 | 55.5 | 3062 | 2 | 0 | 141 | 0 | 3.78 | 3.15 | 9.5 | 114.0 | 5400.0 | 19 | 25 |
205 rows × 27 columns
new_X = feature_extractors(X, callbacks=[create_custom_features]).fillna(0)
discrete_features = new_X.dtypes == int; discrete_features
mi_scores2 = mutual_info_regression(new_X, y, discrete_features=discrete_features)
mi_scores2 = pd.Series(mi_scores2, name="MI Scores", index=new_X.columns).sort_values(ascending=False)
mi_scores2.sort_values(ascending=True).plot(kind='barh', figsize=(8,8))
<matplotlib.axes._subplots.AxesSubplot at 0x7f37ed0d3c50>
new_X_train = feature_extractors(X_train, callbacks=[create_custom_features]).fillna(0)
new_X_holdout = feature_extractors(X_holdout, callbacks=[create_custom_features]).fillna(0)
feature_model(new_X_train, y_train, new_X_holdout, y_holdout, mi_scores, n_cols=17)
{'cv_mean': 0.7993008628952347,
 'holdout': 0.8285570951484964,
 'k': 17,
 'train': 0.9727945533883016}
feature_model(X_train, y_train, X_holdout, y_holdout, mi_scores, n_cols=15)
{'cv_mean': 0.7971583669411606,
 'holdout': 0.8374002645219979,
 'k': 15,
 'train': 0.9663210512717149}
pp = make_pipeline(StandardScaler(), PCA(), ExtraTreesRegressor())
pp
Pipeline(steps=[('standardscaler', StandardScaler()), ('pca', PCA()),
                ('extratreesregressor', ExtraTreesRegressor())])
feature_model(X_train, y_train, X_holdout, y_holdout, mi_scores, n_cols=15, estimator=pp)
{'cv_mean': 0.7887728552753883,
 'holdout': 0.8424713912911774,
 'k': 15,
 'train': 0.9547614236269416}